Advertisements
Advertisements
प्रश्न
Heights of 50 students of class X of a school are recorded and following data is obtained:
| Height (in cm) | 130 – 135 | 135 – 140 | 140 – 145 | 145 – 150 | 150 – 155 | 155 – 160 |
| Number of students | 4 | 11 | 12 | 7 | 10 | 6 |
Find the median height of the students.
उत्तर
Let us first construct the table of cumulative frequency as shown below:
| Height (in cm) |
Number of students (fi) |
Cucumulative Frequency (c.f.) |
| 130 – 135 | 4 | 4 |
| 135 – 140 | 11 | 15 |
| 140 – 145 | 12 | 27 |
| 145 – 150 | 7 | 34 |
| 150 – 155 | 10 | 44 |
| 155 – 160 | 6 | 50 |
| Total | `sum"f"_"i"` = 50 |
Here, `"N"/2 = 50/2` = 25, which lies in cumulative frequency of 27
∴ The median class is 140 – 145.
So, l = 140, c.f. = 15, f = 12 and h = 5
Now, as median (Me) = `"l" + ("N"/2 - "c.f.")/"f" xx "h"`
∴ Required median = `140 + (25 - 15)/12 xx 5`
= `140 + 10/12 xx 5`
= 140 + 4.17
= 144.17
APPEARS IN
संबंधित प्रश्न
The lengths of 40 leaves of a plant are measured correct to the nearest millimeter, and the data obtained is represented in the following table:
| Length (in mm) | Number of leaves |
| 118 − 126 | 3 |
| 127 – 135 | 5 |
| 136 − 144 | 9 |
| 145 – 153 | 12 |
| 154 – 162 | 5 |
| 163 – 171 | 4 |
| 172 – 180 | 2 |
Find the median length of the leaves.
(Hint: The data needs to be converted to continuous classes for finding the median, since the formula assumes continuous classes. The classes then change to 117.5 − 126.5, 126.5 − 135.5… 171.5 − 180.5)
Given below is the number of units of electricity consumed in a week in a certain locality:
| Class | 65 – 85 | 85 – 105 | 105 – 125 | 125 – 145 | 145 – 165 | 165 – 185 | 185 – 200 |
| Frequency | 4 | 5 | 13 | 20 | 14 | 7 | 4 |
Calculate the median.
Calculate the median for the following data:
| Class | 19 – 25 | 26 – 32 | 33 – 39 | 40 – 46 | 47 – 53 | 54 - 60 |
| Frequency | 35 | 96 | 68 | 102 | 35 | 4 |
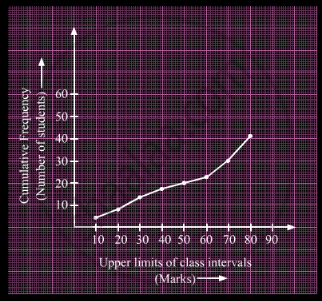
A student draws a cumulative frequency curve for the marks obtained by 40 students of a class as shown below. Find the median marks obtained by the students of the class.

Write the median class of the following distribution:
| Class-interval: | 0−10 | 10−20 | 20−30 | 30−40 | 40−50 | 50−60 | 60−70 |
| Frequency: | 4 | 4 | 8 | 10 | 12 | 8 | 4 |
Find the median of the following frequency distribution:
| x | 10 | 11 | 12 | 13 | 14 | 15 |
| f | 1 | 4 | 7 | 5 | 9 | 3 |
Calculate the median of the following distribution:
| Weight (in nearest kg.) | No. of students |
| 46 | 7 |
| 48 | 5 |
| 50 | 8 |
| 52 | 12 |
| 53 | 10 |
| 54 | 2 |
| 55 | 1 |
Weekly income of 600 families is tabulated below:
| Weekly income (in Rs) |
Number of families |
| 0 – 1000 | 250 |
| 1000 – 2000 | 190 |
| 2000 – 3000 | 100 |
| 3000 – 4000 | 40 |
| 4000 – 5000 | 15 |
| 5000 – 6000 | 5 |
| Total | 600 |
Compute the median income.
The median of the following frequency distribution is 35. Find the value of x.
| Class: | 0 – 10 | 10 – 20 | 20 – 30 | 30 – 40 | 40 – 50 |
| Frequency: | 6 | 3 | x | 12 | 19 |
The following table shows classification of number of workers and number of hours they work in software company. Prepare less than upper limit type cumulative frequency distribution table:
| Number of hours daily | Number of workers |
| 8 - 10 | 150 |
| 10 - 12 | 500 |
| 12 - 14 | 300 |
| 14 - 16 | 50 |
