Advertisements
Advertisements
प्रश्न
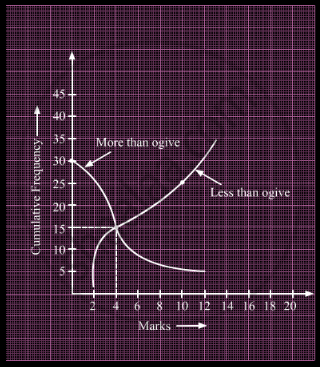
What is the value of the median of the data using the graph in the following figure of less than ogive and more than ogive?

उत्तर
We know that the abscissa of the point of intersection of two ogives gives the median.
From the given figure, it can be seen that both the ogives intersect at the point (4, 15).
∴ Median of the data = 4
APPEARS IN
संबंधित प्रश्न
Estimate the median for the given data by drawing an ogive:
| Class | 0 – 10 | 10 – 20 | 20 – 30 | 30 – 40 | 40 – 50 |
| Frequency | 4 | 9 | 15 | 14 | 8 |
The following table shows the daily wages of workers in a factory:
| Daily wages in (Rs) | 0 – 100 | 100 – 200 | 200 – 300 | 300 – 400 | 400 – 500 |
| Number of workers | 40 | 32 | 48 | 22 | 8 |
Find the median daily wage income of the workers.
Find the median from the following data:
| Class | 1 – 5 | 6 – 10 | 11 – 15 | 16 – 20 | 21 – 25 | 26 – 30 | 31 – 35 | 35 – 40 | 40 – 45 |
| Frequency | 7 | 10 | 16 | 32 | 24 | 16 | 11 | 5 | 2 |
The median of the following observations 11, 12, 14, (x – 2), (x + 4), (x + 9), 32, 38, 47 arranged in ascending order is 24. Find the value of x and hence find the mean.
The following are the marks scored by the students in the Summative Assessment exam
| Class | 0 − 10 | 10 − 20 | 20 − 30 | 30 − 40 | 40 − 50 | 50 − 60 |
| No. of Students | 2 | 7 | 15 | 10 | 11 | 5 |
Calculate the median.
If 35 is removed from the data, 30, 34, 35, 36, 37, 38, 39, 40 then the median increases by ______.
The abscissa of the point of intersection of the less than type and of the more than type cumulative frequency curves of a grouped data gives its ______.
Find the values of a and b, if the sum of all the frequencies is 120 and the median of the following data is 55.
| Marks | 30 – 40 | 40 – 50 | 50 –60 | 60 – 70 | 70 –80 | 80 – 90 |
| Frequency | a | 40 | 27 | b | 15 | 24 |
The median of the following data is 525. Find the values of x and y, if the total frequency is 100.
| Class interval | Frequency |
| 0 – 100 | 2 |
| 100 – 200 | 5 |
| 200 – 300 | x |
| 300 – 400 | 12 |
| 400 – 500 | 17 |
| 500 – 600 | 20 |
| 600 – 700 | y |
| 700 – 800 | 9 |
| 800 – 900 | 7 |
| 900 – 1000 | 4 |
Using the empirical relationship between the three measures of central tendency, find the median of a distribution, whose mean is 169 and mode is 175.
