Advertisements
Advertisements
प्रश्न
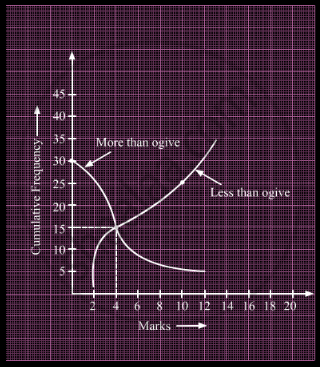
What is the value of the median of the data using the graph in the following figure of less than ogive and more than ogive?

उत्तर
We know that the abscissa of the point of intersection of two ogives gives the median.
From the given figure, it can be seen that both the ogives intersect at the point (4, 15).
∴ Median of the data = 4
APPEARS IN
संबंधित प्रश्न
The median of the following observations
11, 12, 14, (x - 2), (x + 4), (x + 9), 32, 38, 47 arranged in ascending order is 24.
Find the value of x and hence find the mean.
Following is the distribution of I.Q. of loo students. Find the median I.Q.
| I.Q.: | 55 - 64 | 65 - 74 | 75 - 84 | 85 - 94 | 95 - 104 | 105 - 114 | 115 - 124 | 125 - 134 | 135 - 144 |
| No of Students: | 1 | 2 | 9 | 22 | 33 | 22 | 8 | 2 | 1 |
Compute the median for the following data:
| Marks | No. of students |
| Less than 10 | 0 |
| Less than 30 | 10 |
| Less than 50 | 25 |
| Less than 70 | 43 |
| Less than 90 | 65 |
| Less than 110 | 87 |
| Less than 130 | 96 |
| Less than 150 | 100 |
Compute the median for the following data:
| Marks | No. of students |
| More than 150 | 0 |
| More than 140 | 12 |
| More than 130 | 27 |
| More than 120 | 60 |
| More than 110 | 105 |
| More than 100 | 124 |
| More than 90 | 141 |
| More than 80 | 150 |
Calculate the missing frequency from the following distribution, it being given that the median of distribution is 24.
| Class | 0 – 10 | 10 – 20 | 20 – 30 | 30 – 40 | 40 - 50 |
| Frequency | 5 | 25 | ? | 18 | 7 |
The following frequency distribution table gives the ages of 200 patients treated in a hospital in a week. Find the mode of ages of the patients.
| Age (years) | Less than 5 | 5 - 9 | 10 - 14 | 15 - 19 | 20 - 24 | 25 - 29 |
| No. of patients | 38 | 32 | 50 | 36 | 24 | 20 |
The median of an ungrouped data and the median calculated when the same data is grouped are always the same. Do you think that this is a correct statement? Give reason.
The maximum bowling speeds, in km per hour, of 33 players at a cricket coaching centre are given as follows:
| Speed (km/h) | 85 – 100 | 100 – 115 | 115 – 130 | 130 – 145 |
| Number of players | 11 | 9 | 8 | 5 |
Calculate the median bowling speed.
Find the modal and median classes of the following distribution.
| Class | 0 – 20 | 20 – 40 | 40 – 60 | 60 – 80 | 80 – 100 |
| Frequency | 11 | 22 | 19 | 18 | 7 |
The empirical relation between the mode, median and mean of a distribution is ______.
