Advertisements
Advertisements
प्रश्न
The median of the following observations
11, 12, 14, (x - 2), (x + 4), (x + 9), 32, 38, 47 arranged in ascending order is 24.
Find the value of x and hence find the mean.
उत्तर
The observations in ascending order are:
11, 12, 14, (x – 2), (x + 4), (x + 9), 32, 38, 47
Number of observations = n = 9 (odd)
Median = `((n+1)/2)^"th"`observation = 5th observation
∴ x + 4 = 24
`=> x = 20`
Thus, the observations are 11, 12, 14, 18, 24, 29, 32, 38, 47
`:. "Mean" = (11 + 12 + 14 + 18 + 24 + 29 + 32 + 38 + 47)/9 = 225/9 = 25`
APPEARS IN
संबंधित प्रश्न
Below is the given frequency distribution of words in an essay
| Number of Words | Number of Candidates |
| 600 – 800 | 8 |
| 800 – 1000 | 22 |
| 1000 – 1200 | 40 |
| 1200 – 1400 | 18 |
| 1400 - 1600 | 12 |
Find the mean number of words written.
The marks obtained by 19 students of a class are given below:
27, 36, 22, 31, 25, 26, 33, 24, 37, 32, 29, 28, 36, 35, 27, 26, 32, 35 and 28.
Find:
- Median
- Lower quartile
- Upper quartile
- Inter-quartile range
From the following data, find:
Upper quartile
25, 10, 40, 88, 45, 60, 77, 36, 18, 95, 56, 65, 7, 0, 38 and 83
The ages of 37 students in a class are given in the following table:
| Age (in years) | 11 | 12 | 13 | 14 | 15 | 16 |
| Frequency | 2 | 4 | 6 | 10 | 8 | 7 |
Calculate the missing frequency from the following distribution, it being given that the median of distribution is 24.
| Class | 0 – 10 | 10 – 20 | 20 – 30 | 30 – 40 | 40 - 50 |
| Frequency | 5 | 25 | ? | 18 | 7 |
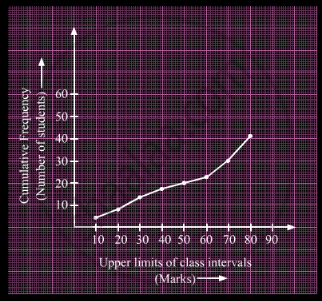
A student draws a cumulative frequency curve for the marks obtained by 40 students of a class as shown below. Find the median marks obtained by the students of the class.

If the median of the data: 24, 25, 26, x + 2, x + 3, 30, 31, 34 is 27.5, then x =
The median of set of 9 distinct observations is 20.5. If each of the largest 4 observations of the set is increased by 2, then the median of the new set ______.
The median of the following frequency distribution is 35. Find the value of x.
| Class: | 0 – 10 | 10 – 20 | 20 – 30 | 30 – 40 | 40 – 50 |
| Frequency: | 6 | 3 | x | 12 | 19 |
The following table gives the monthly consumption of electricity of 100 families:
| Monthly Consumption (in units) |
130 – 140 | 140 – 150 | 150 – 160 | 160 – 170 | 170 – 180 | 180 – 190 | 190 – 200 |
| Number of families |
5 | 9 | 17 | 28 | 24 | 10 | 7 |
Find the median of the above data.
