Advertisements
Advertisements
प्रश्न
The marks obtained by 19 students of a class are given below:
27, 36, 22, 31, 25, 26, 33, 24, 37, 32, 29, 28, 36, 35, 27, 26, 32, 35 and 28.
Find:
- Median
- Lower quartile
- Upper quartile
- Inter-quartile range
उत्तर
Arranging in ascending order:
22, 24, 25, 26, 26, 27, 27, 28, 28, 29, 31, 32, 32, 33, 35, 35, 36, 36, 37
i. Median = `((n + 1)/2)^(th)` term
= `((19 + 1)/2)^(th)`
= `(20/2)^(th)`
= 10th
= 29
ii. Lower quartile (Q1) = `((n + 1)/4)^(th)`
= `((19 + 1)/4)^(th)`
= 5th
= 26
iii. Upper quartile (Q3) = `((3(n + 1))/4)^(th)`
= `((3(19 + 1))/4)^(th)`
= 3 × 5th
= 15th
= 35
iv. Inter-quartile range = Q3 – Q1
= 35 – 26
= 9
APPEARS IN
संबंधित प्रश्न
The table below shows the salaries of 280 persons :
| Salary (In thousand Rs) | No. of Persons |
| 5 – 10 | 49 |
| 10 – 15 | 133 |
| 15 – 20 | 63 |
| 20 – 25 | 15 |
| 25 – 30 | 6 |
| 30 – 35 | 7 |
| 35 – 40 | 4 |
| 40 – 45 | 2 |
| 45 – 50 | 1 |
Calculate the median salary of the data.
From the following data, find:
Inter-quartile range
25, 10, 40, 88, 45, 60, 77, 36, 18, 95, 56, 65, 7, 0, 38 and 83
Find the median from the following data:
| Marks | No of students |
| Below 10 | 12 |
| Below 20 | 32 |
| Below 30 | 57 |
| Below 40 | 80 |
| Below 50 | 92 |
| Below 60 | 116 |
| Below 70 | 164 |
| Below 80 | 200 |
Find the correct answer from the alternatives given.
| Distance Covered per litre (km) | 12 - 14 | 14 - 16 | 16 - 18 | 18 - 20 |
| No. of cars | 11 | 12 | 20 | 7 |
The median of the distances covered per litre shown in the above data is in the group . . . . . .
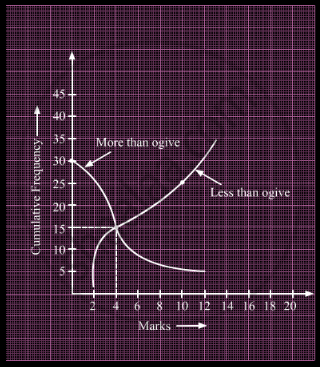
What is the value of the median of the data using the graph in the following figure of less than ogive and more than ogive?

Mode and mean of a data are 12k and 15A. Median of the data is ______.
Weekly income of 600 families is tabulated below:
| Weekly income (in Rs) |
Number of families |
| 0 – 1000 | 250 |
| 1000 – 2000 | 190 |
| 2000 – 3000 | 100 |
| 3000 – 4000 | 40 |
| 4000 – 5000 | 15 |
| 5000 – 6000 | 5 |
| Total | 600 |
Compute the median income.
Find the values of a and b, if the sum of all the frequencies is 120 and the median of the following data is 55.
| Marks | 30 – 40 | 40 – 50 | 50 –60 | 60 – 70 | 70 –80 | 80 – 90 |
| Frequency | a | 40 | 27 | b | 15 | 24 |
The empirical relation between the mode, median and mean of a distribution is ______.
The median of first seven prime numbers is ______.
