Advertisements
Advertisements
प्रश्न
Find the median from the following data:
| Marks | No of students |
| Below 10 | 12 |
| Below 20 | 32 |
| Below 30 | 57 |
| Below 40 | 80 |
| Below 50 | 92 |
| Below 60 | 116 |
| Below 70 | 164 |
| Below 80 | 200 |
उत्तर
| Class | frequency (f) | cumulative frequency (f) |
| 0 – 10 | 12 | 12 |
| 10 – 20 | 32 | (32 - 12) = 20 |
| 20 – 30 | 57 | (57 - 32) = 25 |
| 30 – 40 | 80 | (80 - 57) = 23 |
| 40 – 50 | 92 | (92 - 80) =12 |
| 50 – 60 | 116 | (116 - 92) = 24 |
| 60 – 70 | 164 | (164 - 116) = 48 |
| 70 – 80 | 200 | (200 - 164) = 36 |
| N = Σ𝑓 = 200 |
Now, N = 200
`⇒ N/2 = 100`.
The cumulative frequency just greater than 100 is 116 and the corresponding class is 50 – 60.
Thus, the median class is 50 – 60.
∴ l = 50, h = 10, f = 24, cf = c.f. of preceding class = 92 and `N/2` = 100.
∴ Median, `M = l + {h×((N/2−cf)/f)}`
`= 50 + {10× ((100 − 92)/24)}`
= 50 + 3.33
= 53.33
Hence, median = 53.33.
APPEARS IN
संबंधित प्रश्न
100 surnames were randomly picked up from a local telephone directory and the frequency distribution of the number of letters in the English alphabets in the surnames was obtained as follows:
| Number of letters | Number of surnames |
| 1 - 4 | 6 |
| 4 − 7 | 30 |
| 7 - 10 | 40 |
| 10 - 13 | 6 |
| 13 - 16 | 4 |
| 16 − 19 | 4 |
Determine the median number of letters in the surnames. Find the mean number of letters in the surnames? Also, find the modal size of the surnames.
The median of the following data is 525. Find the missing frequency, if it is given that there are 100 observations in the data:
| Class interval | Frequency |
| 0 - 100 | 2 |
| 100 - 200 | 5 |
| 200 - 300 | f1 |
| 300 - 400 | 12 |
| 400 - 500 | 17 |
| 500 - 600 | 20 |
| 600 - 700 | f2 |
| 700 - 800 | 9 |
| 800 - 900 | 7 |
| 900 - 1000 | 4 |
If the median of the following data is 32.5, find the missing frequencies.
| Class interval: | 0 - 10 | 10 - 20 | 20 - 30 | 30 - 40 | 40 - 50 | 50 - 60 | 60 - 70 | Total |
| Frequency: | f1 | 5 | 9 | 12 | f2 | 3 | 2 | 40 |
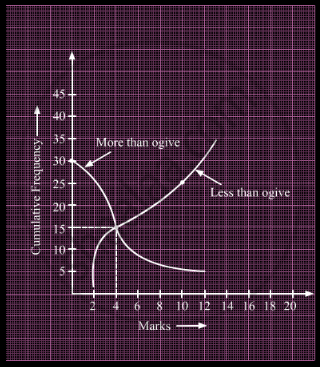
What is the value of the median of the data using the graph in the following figure of less than ogive and more than ogive?

The abscissa of the point of intersection of less than type and of the more than types cumulative frequency curves of a grouped data gives its ______.
The following are the marks scored by the students in the Summative Assessment exam
| Class | 0 − 10 | 10 − 20 | 20 − 30 | 30 − 40 | 40 − 50 | 50 − 60 |
| No. of Students | 2 | 7 | 15 | 10 | 11 | 5 |
Calculate the median.
Mode and mean of a data are 12k and 15A. Median of the data is ______.
Find the values of a and b, if the sum of all the frequencies is 120 and the median of the following data is 55.
| Marks | 30 – 40 | 40 – 50 | 50 –60 | 60 – 70 | 70 –80 | 80 – 90 |
| Frequency | a | 40 | 27 | b | 15 | 24 |
Heights of 50 students of class X of a school are recorded and following data is obtained:
| Height (in cm) | 130 – 135 | 135 – 140 | 140 – 145 | 145 – 150 | 150 – 155 | 155 – 160 |
| Number of students | 4 | 11 | 12 | 7 | 10 | 6 |
Find the median height of the students.
Consider the following frequency distribution:
| Class | 0 – 6 | 6 – 12 | 12 – 18 | 18 – 24 | 24 – 30 |
| Frequency | 12 | 10 | 15 | 8 | 11 |
The median class is:
