Advertisements
Advertisements
प्रश्न
Find the correct answer from the alternatives given.
| Distance Covered per litre (km) | 12 - 14 | 14 - 16 | 16 - 18 | 18 - 20 |
| No. of cars | 11 | 12 | 20 | 7 |
The median of the distances covered per litre shown in the above data is in the group . . . . . .
विकल्प
12-14
14 - 16
16 - 18
18-20
उत्तर
Since, the class 16 - 18 has the highest frequency. Thus, the median of the distances covered per litre will be lie in this class.
APPEARS IN
संबंधित प्रश्न
Below is the given frequency distribution of words in an essay
| Number of Words | Number of Candidates |
| 600 – 800 | 8 |
| 800 – 1000 | 22 |
| 1000 – 1200 | 40 |
| 1200 – 1400 | 18 |
| 1400 - 1600 | 12 |
Find the mean number of words written.
The following table shows ages of 3000 patients getting medical treatment in a hospital on a particular day :
| Age (in years) | No. of Patients |
| 10-20 | 60 |
| 20-30 | 42 |
| 30-40 | 55 |
| 40-50 | 70 |
| 50-60 | 53 |
| 60-70 | 20 |
Find the median age of the patients.
The lengths of 40 leaves of a plant are measured correct to the nearest millimeter, and the data obtained is represented in the following table:
| Length (in mm) | Number of leaves |
| 118 − 126 | 3 |
| 127 – 135 | 5 |
| 136 − 144 | 9 |
| 145 – 153 | 12 |
| 154 – 162 | 5 |
| 163 – 171 | 4 |
| 172 – 180 | 2 |
Find the median length of the leaves.
(Hint: The data needs to be converted to continuous classes for finding the median, since the formula assumes continuous classes. The classes then change to 117.5 − 126.5, 126.5 − 135.5… 171.5 − 180.5)
The mean of following numbers is 68. Find the value of ‘x’. 45, 52, 60, x, 69, 70, 26, 81 and 94. Hence, estimate the median.
Calculate the missing frequency from the following distribution, it being given that the median of the distribution is 24.
| Age in years | 0 - 10 | 10 - 20 | 20 - 30 | 30 - 40 | 40 - 50 |
| No. of persons | 5 | 25 | ? | 18 | 7 |
Find the missing frequencies and the median for the following distribution if the mean is 1.46.
| No. of accidents: | 0 | 1 | 2 | 3 | 4 | 5 | Total |
| Frequency (No. of days): | 46 | ? | ? | 25 | 10 | 5 | 200 |
The median of the following data is 525. Find the missing frequency, if it is given that there are 100 observations in the data:
| Class interval | Frequency |
| 0 - 100 | 2 |
| 100 - 200 | 5 |
| 200 - 300 | f1 |
| 300 - 400 | 12 |
| 400 - 500 | 17 |
| 500 - 600 | 20 |
| 600 - 700 | f2 |
| 700 - 800 | 9 |
| 800 - 900 | 7 |
| 900 - 1000 | 4 |
The following table shows the number of patients of different age groups admitted to a hospital for treatment on a day. Find the median of ages of the patients.
| Age- group (Yrs.) | 10-20 | 20-30 | 30-40 | 40-50 | 50-60 | 60-70 |
| No. of patients | 40 | 32 | 35 | 45 | 33 | 15 |
The annual rainfall record of a city for 66 days is given in the following table :
| Rainfall (in cm ): | 0-10 | 10-20 | 20-30 | 30-40 | 40-50 | 50-60 |
| Number of days : | 22 | 10 | 8 | 15 | 5 | 6 |
Calculate the median rainfall using ogives of more than type and less than type.
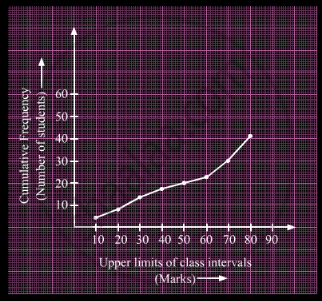
A student draws a cumulative frequency curve for the marks obtained by 40 students of a class as shown below. Find the median marks obtained by the students of the class.
If 35 is removed from the data: 30, 34, 35, 36, 37, 38, 39, 40, then the median increased by
Calculate the median of the following distribution:
| Weight (in nearest kg.) | No. of students |
| 46 | 7 |
| 48 | 5 |
| 50 | 8 |
| 52 | 12 |
| 53 | 10 |
| 54 | 2 |
| 55 | 1 |
Following is the distribution of the long jump competition in which 250 students participated. Find the median distance jumped by the students. Interpret the median
| Distance (in m) |
0 – 1 | 1 – 2 | 2 – 3 | 3 – 4 | 4 – 5 |
| Number of Students |
40 | 80 | 62 | 38 | 30 |
Calculate the median of marks of students for the following distribution:
| Marks | Number of students |
| More than or equal to 0 | 100 |
| More than or equal to 10 | 93 |
| More than or equal to 20 | 88 |
| More than or equal to 30 | 70 |
| More than or equal to 40 | 59 |
| More than or equal to 50 | 42 |
| More than or equal to 60 | 34 |
| More than or equal to 70 | 20 |
| More than or equal to 80 | 11 |
| More than or equal to 90 | 4 |
The median of the following frequency distribution is 35. Find the value of x.
| Class: | 0 – 10 | 10 – 20 | 20 – 30 | 30 – 40 | 40 – 50 |
| Frequency: | 6 | 3 | x | 12 | 19 |
Read the following passage and answer the questions given below.
|
Electric buses are becoming popular nowadays. These buses have the electricity stored in a battery. Electric buses have a range of approximately 280 km with just charge. These buses are superior to diesel buses as they reduce brake wear and also reduce pollution. 'transport department of a city wants to buy some electric buses for the city. So, the department wants to know the distance travelled by existing public transport buses in a day. The following data shows the distance travelled by 50 existing public transport buses in a day.
|
| Daily distance travelled (in km) | 100 – 120 | 120 – 140 | 140 – 160 | 160 – 180 | 180 – 200 |
| Number of buses | 12 | 14 | 8 | 6 | 10 |
- Find the 'median' distance travelled by a bus.
- Find the 'mean (average)' distance travelled by a bus.
The median of 100 observations grouped in classes of equal width is 25. If the median class interval is 20 –30 and the number of observations less than 20 is 45, then the frequency of median class is ______.
The following table shows classification of number of workers and number of hours they work in software company. Prepare less than upper limit type cumulative frequency distribution table:
| Number of hours daily | Number of workers |
| 8 - 10 | 150 |
| 10 - 12 | 500 |
| 12 - 14 | 300 |
| 14 - 16 | 50 |
