Advertisements
Advertisements
प्रश्न
Calculate the median of marks of students for the following distribution:
| Marks | Number of students |
| More than or equal to 0 | 100 |
| More than or equal to 10 | 93 |
| More than or equal to 20 | 88 |
| More than or equal to 30 | 70 |
| More than or equal to 40 | 59 |
| More than or equal to 50 | 42 |
| More than or equal to 60 | 34 |
| More than or equal to 70 | 20 |
| More than or equal to 80 | 11 |
| More than or equal to 90 | 4 |
उत्तर
| Marks Students |
Number of Interval |
Class `(f_i)` |
Frequency frequency `(c.f.)` |
Cumulative |
| More than or equal to 0 | 100 | 0 – 10 | 100 – 93 = 7 | 7 |
| More than or equal to 10 | 93 | 10 –20 | 93 – 88 = 5 | 12 |
| More than or equal to 20 | 88 | 20 –30 | 88 – 70 = 18 | 30 |
| More than or equal to 30 | 70 | 30 –40 | 70 – 59 = 11 | 41 |
| More than or equal to 40 | 59 | 40 –50 | 59 – 42 = 17 | 58 |
| More than or equal to 50 | 42 | 50 – 60 | 42 –34 = 8 | 66 |
| More than or equal to 60 | 34 | 60 – 70 | 34 – 20 = 14 | 80 |
| More than or equal to 70 | 20 | 70 –80 | 20 –11 = 9 | 89 |
| More than or equal to 80 | 11 | 80 – 90 | 11 – 4 = 7 | 96 |
| More than or equal to 90 | 4 | 90 – 100 | 4 – 0 = 4 | 100 |
| `sumf_i` = 100 |
From the table, N = 100
∴ `N/2 = 100/2` = 50
Cumulative frequency (c.f.) just greater than 50 is 58, belonging to interval 40 – 50.
∴ Median class = 40 – 50
So, L = 40, f = 17, c.f. = 41, h = 10
Now, Median = `L + ((N/2 - c.f.)/f) xx h`
= `40 + ((50 - 41)/17) xx 10`
= `40 + (9/17) xx 10`
= 40 + 5.294
= 45.294
As a result, the median score is 45.294.
APPEARS IN
संबंधित प्रश्न
The following table shows ages of 3000 patients getting medical treatment in a hospital on a particular day :
| Age (in years) | No. of Patients |
| 10-20 | 60 |
| 20-30 | 42 |
| 30-40 | 55 |
| 40-50 | 70 |
| 50-60 | 53 |
| 60-70 | 20 |
Find the median age of the patients.
The lengths of 40 leaves of a plant are measured correct to the nearest millimeter, and the data obtained is represented in the following table:
| Length (in mm) | Number of leaves |
| 118 − 126 | 3 |
| 127 – 135 | 5 |
| 136 − 144 | 9 |
| 145 – 153 | 12 |
| 154 – 162 | 5 |
| 163 – 171 | 4 |
| 172 – 180 | 2 |
Find the median length of the leaves.
(Hint: The data needs to be converted to continuous classes for finding the median, since the formula assumes continuous classes. The classes then change to 117.5 − 126.5, 126.5 − 135.5… 171.5 − 180.5)
If the median of the distribution given below is 28.5, find the values of x and y.
| Class interval | Frequency |
| 0 - 10 | 5 |
| 10 - 20 | x |
| 20 - 30 | 20 |
| 30 - 40 | 15 |
| 40 - 50 | y |
| 50 - 60 | 5 |
| Total | 60 |
For a certain frequency distribution, the values of Assumed mean (A) = 1300, `sumf_id_i` = 900 and `sumfi` = 100. Find the value of mean (`barx`) .
The following table gives the frequency distribution of married women by age at marriage:
| Age (in years) | Frequency |
| 15-19 | 53 |
| 20-24 | 140 |
| 25-29 | 98 |
| 30-34 | 32 |
| 35-39 | 12 |
| 40-44 | 9 |
| 45-49 | 5 |
| 50-54 | 3 |
| 55-59 | 3 |
| 60 and above | 2 |
Calculate the median and interpret the results.
If the median of the following data is 32.5, find the missing frequencies.
| Class interval: | 0 - 10 | 10 - 20 | 20 - 30 | 30 - 40 | 40 - 50 | 50 - 60 | 60 - 70 | Total |
| Frequency: | f1 | 5 | 9 | 12 | f2 | 3 | 2 | 40 |
In a hospital, the ages of diabetic patients were recorded as follows. Find the median age.
| Age (in years) |
0 – 15 | 15 – 30 | 30 – 45 | 45 – 60 | 60 - 75 |
| No. of patients | 5 | 20 | 40 | 50 | 25 |
The following frequency distribution table shows the number of mango trees in a grove and their yield of mangoes, and also the cumulative frequencies. Find the median of the data.
| Class (No. of mangoes) |
Frequency (No. of trees) |
Cumulative frequency (less than) |
| 50-100 | 33 | 33 |
| 100-150 | 30 | 63 |
| 150-200 | 90 | 153 |
| 200-250 | 80 | 233 |
| 250-300 | 17 | 250 |
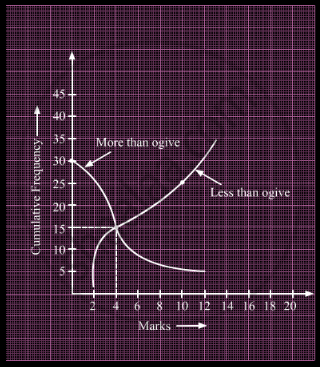
What is the value of the median of the data using the graph in the following figure of less than ogive and more than ogive?

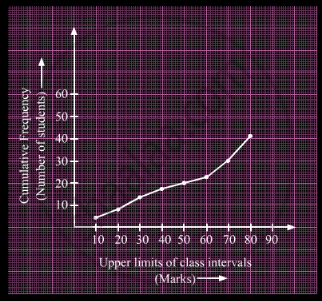
A student draws a cumulative frequency curve for the marks obtained by 40 students of a class as shown below. Find the median marks obtained by the students of the class.

If the median of the data: 24, 25, 26, x + 2, x + 3, 30, 31, 34 is 27.5, then x =
The median of first 10 prime numbers is
In the following table, Σf = 200 and mean = 73. Find the missing frequencies f1, and f2.
| x | 0 | 50 | 100 | 150 | 200 | 250 |
| f | 46 | f1 | f2 | 25 | 10 | 5 |
Find the median of:
66, 98, 54, 92, 87, 63, 72.
Pocket expenses of a class in a college are shown in the following frequency distribution:
| Pocket expenses |
0 - 200 |
200 - 400 |
400 - 600 |
600 - 800 |
800 - 1000 |
1000 - 1200 |
1200 - 1400 |
| Number of students | 33 | 74 | 170 | 88 | 76 | 44 | 25 |
Then the median for the above data is?
The maximum bowling speeds, in km per hour, of 33 players at a cricket coaching centre are given as follows:
| Speed (km/h) | 85 – 100 | 100 – 115 | 115 – 130 | 130 – 145 |
| Number of players | 11 | 9 | 8 | 5 |
Calculate the median bowling speed.
Find the values of a and b, if the sum of all the frequencies is 120 and the median of the following data is 55.
| Marks | 30 – 40 | 40 – 50 | 50 –60 | 60 – 70 | 70 –80 | 80 – 90 |
| Frequency | a | 40 | 27 | b | 15 | 24 |
|
Yoga is an ancient practice which is a form of meditation and exercise. By practising yoga, we not even make our body healthy but also achieve inner peace and calmness. The International Yoga Day is celebrated on the 21st of June every year since 2015.
|
| Age Group | 15 – 25 | 25 – 35 | 35 – 45 | 45 –55 | 55 –65 | 65 –75 | 75 – 85 |
| Number of People |
8 | 10 | 15 | 25 | 40 | 24 | 18 |
Based on the above, find the following:
- Find the median age of people enrolled for the camp.
- If x more people of the age group 65 – 75 had enrolled for the camp, the mean age would have been 58. Find the value of x.
The monthly expenditure on milk in 200 families of a Housing Society is given below:
| Monthly Expenditure (in ₹) |
1000 – 1500 | 1500 – 2000 | 2000 – 2500 | 2500 – 3000 | 3000 – 3500 | 3500 – 4000 | 4000 – 4500 | 4500 – 5000 |
| Number of families | 24 | 40 | 33 | x | 30 | 22 | 16 | 7 |
Find the value of x and also, find the median and mean expenditure on milk.
The following table gives the monthly consumption of electricity of 100 families:
| Monthly Consumption (in units) |
130 – 140 | 140 – 150 | 150 – 160 | 160 – 170 | 170 – 180 | 180 – 190 | 190 – 200 |
| Number of families |
5 | 9 | 17 | 28 | 24 | 10 | 7 |
Find the median of the above data.

