Advertisements
Advertisements
प्रश्न
In the following table, Σf = 200 and mean = 73. Find the missing frequencies f1, and f2.
| x | 0 | 50 | 100 | 150 | 200 | 250 |
| f | 46 | f1 | f2 | 25 | 10 | 5 |
उत्तर
We have,
| x | f | fx |
| 0 | 46 | 0 |
| 50 | f1 | 50f1 |
| 100 | f2 | 100f2 |
| 150 | 25 | 3750 |
| 200 | 10 | 2000 |
| 250 | 5 | 1250 |
| Σf = 86 + f1 + f2 | Σfx = 7000 + 50f1 + 100f2 |
Given, Σf = 200
`=>` 86 + f1 + f2 = 200
`=>` f1 + f2 = 114 ...(i)
Mean = `(Σfx)/(Σf)`
`=> 73 = (7000 + 50f_1 + 100f_2)/200`
`=>` 7000 + 50f1 + 100f2 = 14600
`=>` 50f1 + 100f2 = 7600
`=>` f1 + 2f2 = 152 ...(ii)
Subtracting (ii) from (i), we get
f2 = 38
`=>` f1 = 114 – 38 = 76
Hence, f1 = 76 and f2 = 38
APPEARS IN
संबंधित प्रश्न
If the median of the distribution given below is 28.5, find the values of x and y.
| Class interval | Frequency |
| 0 - 10 | 5 |
| 10 - 20 | x |
| 20 - 30 | 20 |
| 30 - 40 | 15 |
| 40 - 50 | y |
| 50 - 60 | 5 |
| Total | 60 |
Calculate the missing frequency from the following distribution, it being given that the median of the distribution is 24.
| Age in years | 0 - 10 | 10 - 20 | 20 - 30 | 30 - 40 | 40 - 50 |
| No. of persons | 5 | 25 | ? | 18 | 7 |
The following frequency distribution table gives the ages of 200 patients treated in a hospital in a week. Find the mode of ages of the patients.
| Age (years) | Less than 5 | 5 - 9 | 10 - 14 | 15 - 19 | 20 - 24 | 25 - 29 |
| No. of patients | 38 | 32 | 50 | 36 | 24 | 20 |
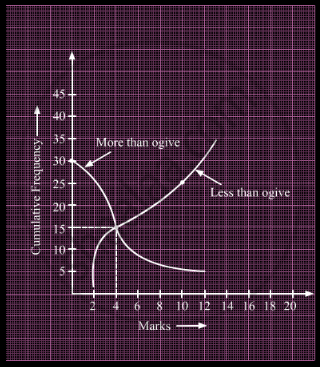
What is the value of the median of the data using the graph in the following figure of less than ogive and more than ogive?

If the median of the data: 24, 25, 26, x + 2, x + 3, 30, 31, 34 is 27.5, then x =
If 35 is removed from the data: 30, 34, 35, 36, 37, 38, 39, 40, then the median increased by
Find a certain frequency distribution, the value of mean and mode are 54.6 and 54 respectively. Find the value of median.
Weekly income of 600 families is tabulated below:
| Weekly income (in Rs) |
Number of families |
| 0 – 1000 | 250 |
| 1000 – 2000 | 190 |
| 2000 – 3000 | 100 |
| 3000 – 4000 | 40 |
| 4000 – 5000 | 15 |
| 5000 – 6000 | 5 |
| Total | 600 |
Compute the median income.
Find the modal and median classes of the following distribution.
| Class | 0 – 20 | 20 – 40 | 40 – 60 | 60 – 80 | 80 – 100 |
| Frequency | 11 | 22 | 19 | 18 | 7 |
The median of 100 observations grouped in classes of equal width is 25. If the median class interval is 20 –30 and the number of observations less than 20 is 45, then the frequency of median class is ______.
