Advertisements
Advertisements
प्रश्न
If the median of the data: 24, 25, 26, x + 2, x + 3, 30, 31, 34 is 27.5, then x =
विकल्प
27
25
28
30
उत्तर
The given observations are 24, 25, 26, x + 2, x + 3, 30, 31, 34.
Median = 27.5
Here, n = 8
Median `=((n/2)^(th) "term" + (n/2 +1)^(th) "term")/2`
`27.5 = (4th "term" +5th "term")/2`
`27.5 = ((x +2) +(x + 3))/2`
`27.5 = (2x +5)/2`
`2x +5 = 55`
`2x = 50`
`X = 25`
Hence, the correct option is (b).
APPEARS IN
संबंधित प्रश्न
A student got the following marks in 9 questions of a question paper.
3, 5, 7, 3, 8, 0, 1, 4 and 6.
Find the median of these marks.
Find the median from the following data:
| Class | 1 – 5 | 6 – 10 | 11 – 15 | 16 – 20 | 21 – 25 | 26 – 30 | 31 – 35 | 35 – 40 | 40 – 45 |
| Frequency | 7 | 10 | 16 | 32 | 24 | 16 | 11 | 5 | 2 |
The following table shows the number of patients of different age groups admitted to a hospital for treatment on a day. Find the median of ages of the patients.
| Age- group (Yrs.) | 10-20 | 20-30 | 30-40 | 40-50 | 50-60 | 60-70 |
| No. of patients | 40 | 32 | 35 | 45 | 33 | 15 |
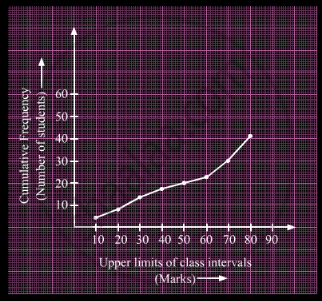
A student draws a cumulative frequency curve for the marks obtained by 40 students of a class as shown below. Find the median marks obtained by the students of the class.

Write the median class of the following distribution:
| Class-interval: | 0−10 | 10−20 | 20−30 | 30−40 | 40−50 | 50−60 | 60−70 |
| Frequency: | 4 | 4 | 8 | 10 | 12 | 8 | 4 |
Find the median of:
66, 98, 54, 92, 87, 63, 72.
Find the median of the scores 7, 10, 5, 8, 9.
For the following distribution
| Marks | 0 - 10 | 10 - 20 | 20 - 30 | 30 - 40 | 40 - 50 |
| No. of Students | 3 | 9 | 13 | 10 | 5 |
the number of students who got marks less than 30 is?
Heights of 50 students of class X of a school are recorded and following data is obtained:
| Height (in cm) | 130 – 135 | 135 – 140 | 140 – 145 | 145 – 150 | 150 – 155 | 155 – 160 |
| Number of students | 4 | 11 | 12 | 7 | 10 | 6 |
Find the median height of the students.
The following table gives the monthly consumption of electricity of 100 families:
| Monthly Consumption (in units) |
130 – 140 | 140 – 150 | 150 – 160 | 160 – 170 | 170 – 180 | 180 – 190 | 190 – 200 |
| Number of families |
5 | 9 | 17 | 28 | 24 | 10 | 7 |
Find the median of the above data.
