Advertisements
Advertisements
प्रश्न
The annual rainfall record of a city for 66 days is given in the following table :
| Rainfall (in cm ): | 0-10 | 10-20 | 20-30 | 30-40 | 40-50 | 50-60 |
| Number of days : | 22 | 10 | 8 | 15 | 5 | 6 |
Calculate the median rainfall using ogives of more than type and less than type.
उत्तर
Prepare a table for less than type.
| Rainfall (in cm) |
Number of Days |
Rainfall (Less Than) |
Cumulative Frequency |
Suitable Points |
| 0−10 | 22 | 10 | 22 | (10, 22) |
| 10−20 | 10 | 20 | 32 | (20, 32) |
| 20−30 | 8 | 30 | 40 | (30, 40) |
| 30−40 | 15 | 40 | 55 | (40, 55) |
| 40−50 | 5 | 50 | 60 | (50, 60) |
| 50−60 | 6 | 60 | 66 | (60, 66) |
Now, plot the less than ogive using suitable points.
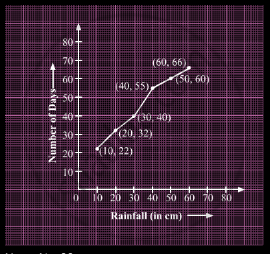
Here, N = 66.
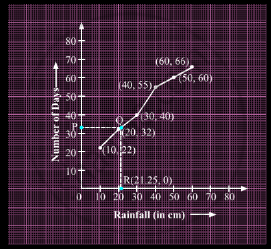
Let us now prepare a table for more than type.
| Rainfall (in cm) |
Number of Days |
Rainfall (More Than) |
Cumulative Frequency |
Suitable Points |
| 0−10 | 22 | 0 | 66(0, 66) | (0, 66) |
| 10−20 | 10 | 10 | 44 | (10, 44) |
| 20−30 | 8 | 20 | 34 | (20, 34) |
| 30−40 | 15 | 30 | 26 | (30, 26) |
| 40−50 | 5 | 40 | 11 | (40, 11) |
| 50−60 | 6 | 50 | 6 | (50, 6) |
Now, plot the more than ogive with suitable points.
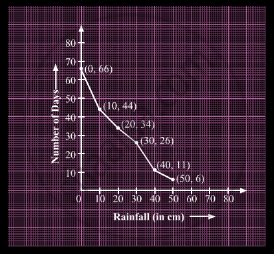
Here, N = 66.
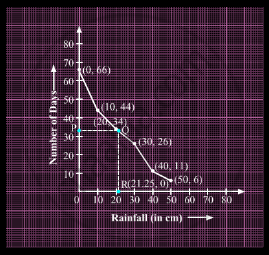
Thus, the median rainfall is 21.25 cm.
APPEARS IN
संबंधित प्रश्न
An incomplete distribution is given as follows:
| Variable: | 0 - 10 | 10 - 20 | 20 - 30 | 30 - 40 | 40 - 50 | 50 - 60 | 60 - 70 |
| Frequency: | 10 | 20 | ? | 40 | ? | 25 | 15 |
You are given that the median value is 35 and the sum of all the frequencies is 170. Using the median formula, fill up the missing frequencies.
If the median of the following data is 32.5, find the missing frequencies.
| Class interval: | 0 - 10 | 10 - 20 | 20 - 30 | 30 - 40 | 40 - 50 | 50 - 60 | 60 - 70 | Total |
| Frequency: | f1 | 5 | 9 | 12 | f2 | 3 | 2 | 40 |
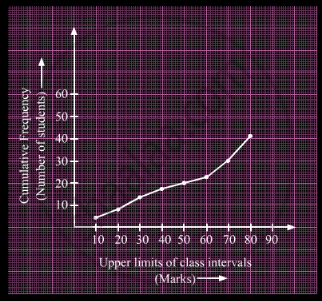
A student draws a cumulative frequency curve for the marks obtained by 40 students of a class as shown below. Find the median marks obtained by the students of the class.
If the difference of Mode and Median of a data is 24, then the difference of median and mean is ______.
Find the median of:
66, 98, 54, 92, 87, 63, 72.
Calculate the median of the following distribution:
| Weight (in nearest kg.) | No. of students |
| 46 | 7 |
| 48 | 5 |
| 50 | 8 |
| 52 | 12 |
| 53 | 10 |
| 54 | 2 |
| 55 | 1 |
The following are the marks scored by the students in the Summative Assessment exam
| Class | 0 − 10 | 10 − 20 | 20 − 30 | 30 − 40 | 40 − 50 | 50 − 60 |
| No. of Students | 2 | 7 | 15 | 10 | 11 | 5 |
Calculate the median.
The median of set of 9 distinct observations is 20.5. If each of the largest 4 observations of the set is increased by 2, then the median of the new set ______.
|
Yoga is an ancient practice which is a form of meditation and exercise. By practising yoga, we not even make our body healthy but also achieve inner peace and calmness. The International Yoga Day is celebrated on the 21st of June every year since 2015.
|
| Age Group | 15 – 25 | 25 – 35 | 35 – 45 | 45 –55 | 55 –65 | 65 –75 | 75 – 85 |
| Number of People |
8 | 10 | 15 | 25 | 40 | 24 | 18 |
Based on the above, find the following:
- Find the median age of people enrolled for the camp.
- If x more people of the age group 65 – 75 had enrolled for the camp, the mean age would have been 58. Find the value of x.
The following table shows classification of number of workers and number of hours they work in software company. Prepare less than upper limit type cumulative frequency distribution table:
| Number of hours daily | Number of workers |
| 8 - 10 | 150 |
| 10 - 12 | 500 |
| 12 - 14 | 300 |
| 14 - 16 | 50 |

