Advertisements
Advertisements
प्रश्न
During the medical check-up of 35 students of a class, their weights were recorded as follows:
| Weight (in kg | Number of students |
| Less than 38 | 0 |
| Less than 40 | 3 |
| Less than 42 | 5 |
| Less than 44 | 9 |
| Less than 46 | 14 |
| Less than 48 | 28 |
| Less than 50 | 32 |
| Less than 52 | 35 |
Draw a less than type ogive for the given data. Hence obtain the median weight from the graph verify the result by using the formula.
उत्तर
The given cumulative frequency distributions of less than type are
|
Weight (in kg upper class limits |
Number of students (cumulative frequency) |
| Less than 38 | 0 |
| Less than 40 | 3 |
| Less than 42 | 5 |
| Less than 44 | 9 |
| Less than 46 | 14 |
| Less than 48 | 28 |
| Less than 50 | 32 |
| Less than 52 | 35 |
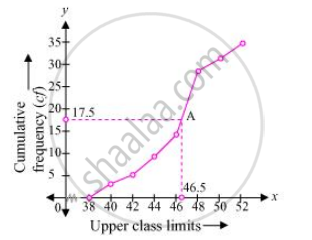
Taking upper class limits on x-axis and their respective cumulative frequencies on y-axis, its ogive can be drawn as follows.

Here, n = 35
So n/2 = 17.5
Mark the point A whose ordinate is 17.5 and its x-coordinate is 46.5. Therefore, median of this data is 46.5
It can be observed that the difference between two consecutive upper class limits is 2. The class marks with their respective frequencies are obtained as below
| Weight (in kg) | Frequency (f) | Cumulative frequency |
| Less than 38 | 0 | 0 |
| 38 − 40 | 3 − 0 = 3 | 3 |
| 40 − 42 | 5 − 3 = 2 | 5 |
| 42 − 44 | 9 − 5 = 4 | 9 |
| 44 − 46 | 14 − 9 = 5 | 14 |
| 46 − 48 | 28 − 14 = 14 | 28 |
| 48 − 50 | 32 − 28 = 4 | 32 |
| 50 − 52 | 35 − 32 = 3 | 35 |
| Total (n) | 35 |
The cumulative frequency just greater than n/2 (35/2 = 17.5) is 28, belonging to class interval 46 − 48.
Median class = 46 − 48
Lower class limit (l) of median class = 46
Frequency (f) of median class = 14
Cumulative frequency (cf) of class preceding median class = 14
Class size (h) = 2
`"Median" = l + ((n/2-cf)/f)xxh`
= `46 + ((17.5-14)/14)xx2`
= 46+ 3.5/7
= 46.5
Therefore, median of this data is 46.5.
Hence, the value of median is verified.
संबंधित प्रश्न
The monthly profits (in Rs.) of 100 shops are distributed as follows:
| Profits per shop: | 0 - 50 | 50 - 100 | 100 - 150 | 150 - 200 | 200 - 250 | 250 - 300 |
| No. of shops: | 12 | 18 | 27 | 20 | 17 | 6 |
Draw the frequency polygon for it.
The following table, construct the frequency distribution of the percentage of marks obtained by 2300 students in a competitive examination.
| Marks obtained (in percent) | 11 – 20 | 21 – 30 | 31 – 40 | 41 – 50 | 51 – 60 | 61 – 70 | 71 – 80 |
| Number of Students | 141 | 221 | 439 | 529 | 495 | 322 | 153 |
(a) Convert the given frequency distribution into the continuous form.
(b) Find the median class and write its class mark.
(c) Find the modal class and write its cumulative frequency.
Calculate the missing frequency form the following distribution, it being given that the median of the distribution is 24
| Age (in years) | 0 – 10 | 10 – 20 | 20 – 30 | 30 – 40 | 40 – 50 |
| Number of persons |
5 | 25 | ? | 18 | 7 |
For a frequency distribution, mean, median and mode are connected by the relation
The mean of a discrete frequency distribution xi / fi, i = 1, 2, ......, n is given by
Consider the following frequency distributions
| Class | 65 - 85 | 85 - 105 | 105 - 125 | 125 - 145 | 145 - 165 | 165 - 185 | 185-205 |
| Frequency | 4 | 5 | 13 | 20 | 14 | 7 | 4 |
The difference of the upper limit of the median class and the lower limit of the modal class is?
The arithmetic mean of the following frequency distribution is 53. Find the value of k.
| Class | 0-20 | 20-40 | 40-60 | 60-80 | 80-100 |
| Frequency | 12 | 15 | 32 | k | 13 |
Change the following distribution to a 'more than type' distribution. Hence draw the 'more than type' ogive for this distribution.
| Class interval: | 20−30 | 30−40 | 40−50 | 50−60 | 60−70 | 70−80 | 80−90 |
| Frequency: | 10 | 8 | 12 | 24 | 6 | 25 | 15 |
The following are the ages of 300 patients getting medical treatment in a hospital on a particular day:
| Age (in years) | 10 – 20 | 20 – 30 | 30 – 40 | 40 – 50 | 50 – 60 | 60 – 70 |
| Number of patients | 60 | 42 | 55 | 70 | 53 | 20 |
Form: More than type cumulative frequency distribution.
Given below is a cumulative frequency distribution showing the marks secured by 50 students of a class:
| Marks | Below 20 | Below 40 | Below 60 | Below 80 | Below 100 |
| Number of students | 17 | 22 | 29 | 37 | 50 |
Form the frequency distribution table for the data.
