Advertisements
Advertisements
प्रश्न
The following distribution gives the daily income of 50 workers of a factory.
| Daily income (in Rs | 100 − 120 | 120 − 140 | 140 − 160 | 160 − 180 | 180 − 200 |
| Number of workers | 12 | 14 | 8 | 6 | 10 |
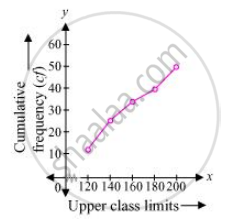
Convert the distribution above to a less than type cumulative frequency distribution, and draw its ogive.
उत्तर
The frequency distribution table of less than type is as follows
|
Daily income (in Rs) (upper class limits) |
Cumulative frequency |
| Less than 120 | 12 |
| Less than 140 | 12 + 14 = 26 |
| Less than 160 | 26 + 8 = 34 |
| Less than 180 | 34 + 6 = 40 |
| Less than 200 | 40 + 10 = 50 |
Taking upper class limits of class intervals on x-axis and their respective frequencies on y-axis, its ogive can be drawn as follows.

APPEARS IN
संबंधित प्रश्न
The table given below shows the weekly expenditures on food of some households in a locality
| Weekly expenditure (in Rs) | Number of house holds |
| 100 – 200 | 5 |
| 200- 300 | 6 |
| 300 – 400 | 11 |
| 400 – 500 | 13 |
| 500 – 600 | 5 |
| 600 – 700 | 4 |
| 700 – 800 | 3 |
| 800 – 900 | 2 |
Draw a ‘less than type ogive’ and a ‘more than type ogive’ for this distribution.
From the following frequency, prepare the ‘more than’ ogive.
| Score | Number of candidates |
| 400 – 450 | 20 |
| 450 – 500 | 35 |
| 500 – 550 | 40 |
| 550 – 600 | 32 |
| 600 – 650 | 24 |
| 650 – 700 | 27 |
| 700 – 750 | 18 |
| 750 – 800 | 34 |
| Total | 230 |
Also, find the median.
The marks obtained by 100 students of a class in an examination are given below:
| Marks | Number of students |
| 0 – 5 | 2 |
| 5 – 10 | 5 |
| 10 – 15 | 6 |
| 15 – 20 | 8 |
| 20 – 25 | 10 |
| 25 – 30 | 25 |
| 30 – 35 | 20 |
| 35 – 40 | 18 |
| 40 – 45 | 4 |
| 45 – 50 | 2 |
Draw cumulative frequency curves by using (i) ‘less than’ series and (ii) ‘more than’ series.Hence, find the median.
From the following data, draw the two types of cumulative frequency curves and determine the median:
| Marks | Frequency |
| 140 – 144 | 3 |
| 144 – 148 | 9 |
| 148 – 152 | 24 |
| 152 – 156 | 31 |
| 156 – 160 | 42 |
| 160 – 164 | 64 |
| 164 – 168 | 75 |
| 168 – 172 | 82 |
| 172 – 176 | 86 |
| 176 – 180 | 34 |
The following frequency distribution gives the monthly consumption of electricity of 64 consumers of locality.
| Monthly consumption (in units) | 65 – 85 | 85 – 105 | 105 – 125 | 125 – 145 | 145 – 165 | 165 – 185 |
| Number of consumers | 4 | 5 | 13 | 20 | 14 | 8 |
Form a ‘ more than type’ cumulative frequency distribution.
Calculate the missing frequency form the following distribution, it being given that the median of the distribution is 24
| Age (in years) | 0 – 10 | 10 – 20 | 20 – 30 | 30 – 40 | 40 – 50 |
| Number of persons |
5 | 25 | ? | 18 | 7 |
Consider the following frequency distribution :
| Class: | 0-5 | 6-11 | 12-17 | 18-23 | 24-29 |
| Frequency: | 13 | 10 | 15 | 8 | 11 |
The upper limit of the median class is
If the median of the following frequency distribution is 32.5. Find the values of f1 and f2.
| Class | 0-10 | 10-20 | 20-30 | 30-40 | 40-50 | 50-60 | 60-70 | Total |
| Frequency | f1 | 5 | 9 | 12 | f2 | 3 | 2 | 40 |
For the following distribution:
| C.I. | 0 - 5 | 6 - 11 | 12 - 17 | 18 - 23 | 24 - 29 |
| f | 13 | 10 | 15 | 8 | 11 |
the upper limit of the median class is?
The following is the distribution of weights (in kg) of 40 persons:
| Weight (in kg) | 40 – 45 | 45 – 50 | 50 – 55 | 55 – 60 | 60 – 65 | 65 – 70 | 70 – 75 | 75 – 80 |
| Number of persons | 4 | 4 | 13 | 5 | 6 | 5 | 2 | 1 |
Construct a cumulative frequency distribution (of the less than type) table for the data above.
