Advertisements
Advertisements
प्रश्न
The following distribution gives the daily income of 50 workers of a factory.
| Daily income (in Rs | 100 − 120 | 120 − 140 | 140 − 160 | 160 − 180 | 180 − 200 |
| Number of workers | 12 | 14 | 8 | 6 | 10 |
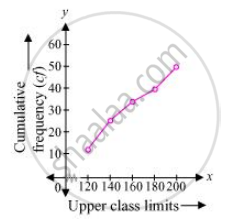
Convert the distribution above to a less than type cumulative frequency distribution, and draw its ogive.
उत्तर
The frequency distribution table of less than type is as follows
|
Daily income (in Rs) (upper class limits) |
Cumulative frequency |
| Less than 120 | 12 |
| Less than 140 | 12 + 14 = 26 |
| Less than 160 | 26 + 8 = 34 |
| Less than 180 | 34 + 6 = 40 |
| Less than 200 | 40 + 10 = 50 |
Taking upper class limits of class intervals on x-axis and their respective frequencies on y-axis, its ogive can be drawn as follows.

APPEARS IN
संबंधित प्रश्न
The heights of 50 girls of Class X of a school are recorded as follows:
| Height (in cm) | 135 - 140 | 140 – 145 | 145 – 150 | 150 – 155 | 155 – 160 | 160 – 165 |
| No of Students | 5 | 8 | 9 | 12 | 14 | 2 |
Draw a ‘more than type’ ogive for the above data.
The following table gives the production yield per hectare of wheat of 100 farms of a village.
| Production Yield (kg/ha) | 50 –55 | 55 –60 | 60 –65 | 65- 70 | 70 – 75 | 75 80 |
| Number of farms | 2 | 8 | 12 | 24 | 238 | 16 |
Change the distribution to a ‘more than type’ distribution and draw its ogive. Using ogive, find the median of the given data.
The following table gives the life-time (in days) of 100 electric bulbs of a certain brand.
| Life-tine (in days) | Less than 50 |
Less than 100 |
Less than 150 |
Less than 200 |
Less than 250 |
Less than 300 |
| Number of Bulbs | 7 | 21 | 52 | 9 | 91 | 100 |
Write the modal class for the following frequency distribution:
| Class-interval: | 10−15 | 15−20 | 20−25 | 25−30 | 30−35 | 35−40 |
| Frequency: | 30 | 35 | 75 | 40 | 30 | 15 |
The median of a given frequency distribution is found graphically with the help of
The mode of a frequency distribution can be determined graphically from ______.
Consider the following frequency distribution :
| Class: | 0-5 | 6-11 | 12-17 | 18-23 | 24-29 |
| Frequency: | 13 | 10 | 15 | 8 | 11 |
The upper limit of the median class is
If the median of the following frequency distribution is 32.5. Find the values of f1 and f2.
The arithmetic mean of the following frequency distribution is 53. Find the value of k.
| Class | 0-20 | 20-40 | 40-60 | 60-80 | 80-100 |
| Frequency | 12 | 15 | 32 | k | 13 |
Consider the following distribution:
| Marks obtained | Number of students |
| More than or equal to 0 | 63 |
| More than or equal to 10 | 58 |
| More than or equal to 20 | 55 |
| More than or equal to 30 | 51 |
| More than or equal to 40 | 48 |
| More than or equal to 50 | 42 |
The frequency of the class 30 – 40 is:
