Advertisements
Advertisements
प्रश्न
The following table gives production yield per hectare of wheat of 100 farms of a village.
| Production yield (in kg/ha) | 50 − 55 | 55 − 60 | 60 − 65 | 65 − 70 | 70 − 75 | 75 − 80 |
| Number of farms | 2 | 8 | 12 | 24 | 38 | 16 |
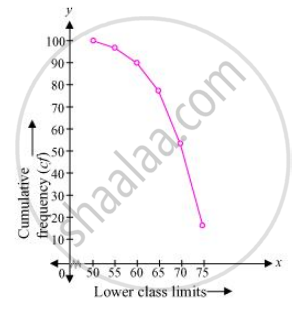
Change the distribution to a more than type distribution and draw ogive.
उत्तर
The cumulative frequency distribution of more than type can be obtained as follows.
|
Production yield (lower class limits) |
Cumulative frequency |
| more than or equal to 50 | 100 |
| more than or equal to 55 | 100 − 2 = 98 |
| more than or equal to 60 | 98 − 8 = 90 |
| more than or equal to 65 | 90 − 12 = 78 |
| more than or equal to 70 | 78 − 24 = 54 |
| more than or equal to 75 | 54 − 38 = 16 |
Taking the lower class limits on x-axis and their respective cumulative frequencies on y-axis, its ogive can be obtained as follows.

APPEARS IN
संबंधित प्रश्न
The following distribution gives the daily income of 50 workers of a factory.
| Daily income (in Rs | 100 − 120 | 120 − 140 | 140 − 160 | 160 − 180 | 180 − 200 |
| Number of workers | 12 | 14 | 8 | 6 | 10 |
Convert the distribution above to a less than type cumulative frequency distribution, and draw its ogive.
Find the median of the following data by making a ‘less than ogive’.
| Marks | 0 - 10 | 10-20 | 20 - 30 | 30 - 40 | 40 - 50 | 50 - 60 | 60 - 70 | 70 - 80 | 80-90 | 90-100 |
| Number of Students | 5 | 3 | 4 | 3 | 3 | 4 | 7 | 9 | 7 | 8 |
What is the lower limit of the modal class of the following frequency distribution?
| Age (in years) | 0 - 10 | 10- 20 | 20 -30 | 30 – 40 | 40 –50 | 50 – 60 |
| Number of patients | 16 | 13 | 6 | 11 | 27 | 18 |
The monthly pocket money of 50 students of a class are given in the following distribution
| Monthly pocket money (in Rs) | 0 - 50 | 50 – 100 | 100 – 150 | 150 -200 | 200 – 250 | 250 - 300 |
| Number of Students | 2 | 7 | 8 | 30 | 12 | 1 |
Find the modal class and give class mark of the modal class.
The following frequency distribution gives the monthly consumption of electricity of 64 consumers of locality.
| Monthly consumption (in units) | 65 – 85 | 85 – 105 | 105 – 125 | 125 – 145 | 145 – 165 | 165 – 185 |
| Number of consumers | 4 | 5 | 13 | 20 | 14 | 8 |
Form a ‘ more than type’ cumulative frequency distribution.
The following is the cumulative frequency distribution ( of less than type ) of 1000 persons each of age 20 years and above . Determine the mean age .
| Age below (in years): | 30 | 40 | 50 | 60 | 70 | 80 |
| Number of persons : | 100 | 220 | 350 | 750 | 950 | 1000 |
The mode of a frequency distribution can be determined graphically from ______.
Consider the following frequency distributions
| Class | 65 - 85 | 85 - 105 | 105 - 125 | 125 - 145 | 145 - 165 | 165 - 185 | 185-205 |
| Frequency | 4 | 5 | 13 | 20 | 14 | 7 | 4 |
The difference of the upper limit of the median class and the lower limit of the modal class is?
Find the unknown entries a, b, c, d, e, f in the following distribution of heights of students in a class:
| Height (in cm) |
Frequency | Cumulative frequency |
| 150 – 155 | 12 | a |
| 155 – 160 | b | 25 |
| 160 – 165 | 10 | c |
| 165 – 170 | d | 43 |
| 170 – 175 | e | 48 |
| 175 – 180 | 2 | f |
| Total | 50 |
Given below is a cumulative frequency distribution showing the marks secured by 50 students of a class:
| Marks | Below 20 | Below 40 | Below 60 | Below 80 | Below 100 |
| Number of students | 17 | 22 | 29 | 37 | 50 |
Form the frequency distribution table for the data.
