Advertisements
Advertisements
Question
The following table gives production yield per hectare of wheat of 100 farms of a village.
| Production yield (in kg/ha) | 50 − 55 | 55 − 60 | 60 − 65 | 65 − 70 | 70 − 75 | 75 − 80 |
| Number of farms | 2 | 8 | 12 | 24 | 38 | 16 |
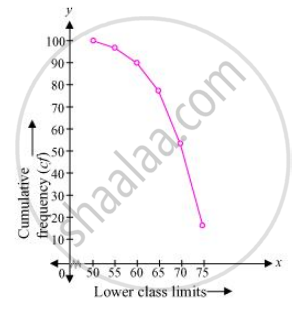
Change the distribution to a more than type distribution and draw ogive.
Solution
The cumulative frequency distribution of more than type can be obtained as follows.
|
Production yield (lower class limits) |
Cumulative frequency |
| more than or equal to 50 | 100 |
| more than or equal to 55 | 100 − 2 = 98 |
| more than or equal to 60 | 98 − 8 = 90 |
| more than or equal to 65 | 90 − 12 = 78 |
| more than or equal to 70 | 78 − 24 = 54 |
| more than or equal to 75 | 54 − 38 = 16 |
Taking the lower class limits on x-axis and their respective cumulative frequencies on y-axis, its ogive can be obtained as follows.

APPEARS IN
RELATED QUESTIONS
During the medical check-up of 35 students of a class, their weights were recorded as follows:
| Weight (in kg | Number of students |
| Less than 38 | 0 |
| Less than 40 | 3 |
| Less than 42 | 5 |
| Less than 44 | 9 |
| Less than 46 | 14 |
| Less than 48 | 28 |
| Less than 50 | 32 |
| Less than 52 | 35 |
Draw a less than type ogive for the given data. Hence obtain the median weight from the graph verify the result by using the formula.
Draw a ‘more than’ ogive for the data given below which gives the marks of 100 students.
| Marks | 0 – 10 | 10 – 20 | 20 – 30 | 30 - 40 | 40 – 50 | 50 – 60 | 60 – 70 | 70 – 80 |
| No of Students | 4 | 6 | 10 | 10 | 25 | 22 | 18 | 5 |
The table given below shows the weekly expenditures on food of some households in a locality
| Weekly expenditure (in Rs) | Number of house holds |
| 100 – 200 | 5 |
| 200- 300 | 6 |
| 300 – 400 | 11 |
| 400 – 500 | 13 |
| 500 – 600 | 5 |
| 600 – 700 | 4 |
| 700 – 800 | 3 |
| 800 – 900 | 2 |
Draw a ‘less than type ogive’ and a ‘more than type ogive’ for this distribution.
Write the median class of the following distribution:
| Class | 0 – 10 | 10 -20 | 20- 30 | 30- 40 | 40-50 | 50- 60 | 60- 70 |
| Frequency | 4 | 4 | 8 | 10 | 12 | 8 | 4 |
The following table gives the life-time (in days) of 100 electric bulbs of a certain brand.
| Life-tine (in days) | Less than 50 |
Less than 100 |
Less than 150 |
Less than 200 |
Less than 250 |
Less than 300 |
| Number of Bulbs | 7 | 21 | 52 | 9 | 91 | 100 |
The median of the distribution given below is 14.4 . Find the values of x and y , if the total frequency is 20.
| Class interval : | 0-6 | 6-12 | 12-18 | 18-24 | 24-30 |
| Frequency : | 4 | x | 5 | y | 1 |
Write the median class for the following frequency distribution:
| Class-interval: | 0−10 | 10−20 | 20−30 | 30−40 | 40−50 | 50−60 | 60−70 | 70−80 |
| Frequency: | 5 | 8 | 7 | 12 | 28 | 20 | 10 | 10 |
Change the following distribution to a 'more than type' distribution. Hence draw the 'more than type' ogive for this distribution.
| Class interval: | 20−30 | 30−40 | 40−50 | 50−60 | 60−70 | 70−80 | 80−90 |
| Frequency: | 10 | 8 | 12 | 24 | 6 | 25 | 15 |
Consider the following distribution:
| Marks obtained | Number of students |
| More than or equal to 0 | 63 |
| More than or equal to 10 | 58 |
| More than or equal to 20 | 55 |
| More than or equal to 30 | 51 |
| More than or equal to 40 | 48 |
| More than or equal to 50 | 42 |
The frequency of the class 30 – 40 is:
Form the frequency distribution table from the following data:
| Marks (out of 90) | Number of candidates |
| More than or equal to 80 | 4 |
| More than or equal to 70 | 6 |
| More than or equal to 60 | 11 |
| More than or equal to 50 | 17 |
| More than or equal to 40 | 23 |
| More than or equal to 30 | 27 |
| More than or equal to 20 | 30 |
| More than or equal to 10 | 32 |
| More than or equal to 0 | 34 |
