Advertisements
Advertisements
Question
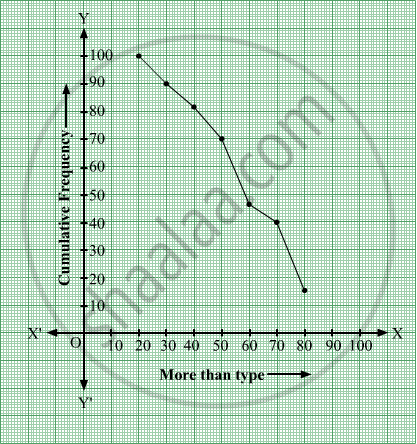
Change the following distribution to a 'more than type' distribution. Hence draw the 'more than type' ogive for this distribution.
| Class interval: | 20−30 | 30−40 | 40−50 | 50−60 | 60−70 | 70−80 | 80−90 |
| Frequency: | 10 | 8 | 12 | 24 | 6 | 25 | 15 |
Solution
| Class interval | Cumulative Frequency |
| More than 20 | 100 |
| More than 30 | 90 |
| More than 40 | 82 |
| More than 50 | 70 |
| More than 60 | 46 |
| More than 70 | 40 |
| More than 80 | 15 |
APPEARS IN
RELATED QUESTIONS
The following table gives production yield per hectare of wheat of 100 farms of a village.
| Production yield (in kg/ha) | 50 − 55 | 55 − 60 | 60 − 65 | 65 − 70 | 70 − 75 | 75 − 80 |
| Number of farms | 2 | 8 | 12 | 24 | 38 | 16 |
Change the distribution to a more than type distribution and draw ogive.
The monthly consumption of electricity (in units) of some families of a locality is given in the following frequency distribution:
| Monthly Consumption (in units) | 140 – 160 | 160 – 180 | 180 – 200 | 200 – 220 | 220 – 240 | 240 – 260 | 260 - 280 |
| Number of Families | 3 | 8 | 15 | 40 | 50 | 30 | 10 |
Prepare a ‘more than type’ ogive for the given frequency distribution.
The following table gives the production yield per hectare of wheat of 100 farms of a village.
| Production Yield (kg/ha) | 50 –55 | 55 –60 | 60 –65 | 65- 70 | 70 – 75 | 75 80 |
| Number of farms | 2 | 8 | 12 | 24 | 238 | 16 |
Change the distribution to a ‘more than type’ distribution and draw its ogive. Using ogive, find the median of the given data.
From the following data, draw the two types of cumulative frequency curves and determine the median:
| Marks | Frequency |
| 140 – 144 | 3 |
| 144 – 148 | 9 |
| 148 – 152 | 24 |
| 152 – 156 | 31 |
| 156 – 160 | 42 |
| 160 – 164 | 64 |
| 164 – 168 | 75 |
| 168 – 172 | 82 |
| 172 – 176 | 86 |
| 176 – 180 | 34 |
Write the modal class for the following frequency distribution:
| Class-interval: | 10−15 | 15−20 | 20−25 | 25−30 | 30−35 | 35−40 |
| Frequency: | 30 | 35 | 75 | 40 | 30 | 15 |
In the formula `barx=a+h((sumf_iu_i)/(sumf_i))`, for finding the mean of grouped frequency distribution ui = ______.
For the following distribution:
| C.I. | 0 - 5 | 6 - 11 | 12 - 17 | 18 - 23 | 24 - 29 |
| f | 13 | 10 | 15 | 8 | 11 |
the upper limit of the median class is?
If the sum of all the frequencies is 24, then the value of z is:
| Variable (x) | 1 | 2 | 3 | 4 | 5 |
| Frequency | z | 5 | 6 | 1 | 2 |
Form the frequency distribution table from the following data:
| Marks (out of 90) | Number of candidates |
| More than or equal to 80 | 4 |
| More than or equal to 70 | 6 |
| More than or equal to 60 | 11 |
| More than or equal to 50 | 17 |
| More than or equal to 40 | 23 |
| More than or equal to 30 | 27 |
| More than or equal to 20 | 30 |
| More than or equal to 10 | 32 |
| More than or equal to 0 | 34 |
The following are the ages of 300 patients getting medical treatment in a hospital on a particular day:
| Age (in years) | 10 – 20 | 20 – 30 | 30 – 40 | 40 – 50 | 50 – 60 | 60 – 70 |
| Number of patients | 60 | 42 | 55 | 70 | 53 | 20 |
Form: More than type cumulative frequency distribution.
