Advertisements
Advertisements
Question
The monthly consumption of electricity (in units) of some families of a locality is given in the following frequency distribution:
| Monthly Consumption (in units) | 140 – 160 | 160 – 180 | 180 – 200 | 200 – 220 | 220 – 240 | 240 – 260 | 260 - 280 |
| Number of Families | 3 | 8 | 15 | 40 | 50 | 30 | 10 |
Prepare a ‘more than type’ ogive for the given frequency distribution.
Solution
The frequency distribution table of more than type is as follows:
| Height (in cm) (lower class limit) | Cumulative frequency (cf) |
| More than 140 | 3 + 153 = 156 |
| More than 160 | 8 + 145 = 153 |
| More than 180 | 15 + 130 = 145 |
| More than 200 | 40 + 90 = 130 |
| More than 220 | 50 + 40 = 90 |
| More than 240 | 30 + 10 = 40 |
| More than 260 | 10 |
Taking the lower class limits of on x-axis and their respective cumulative frequencies ony-axis, its ogive can be drawn as follows: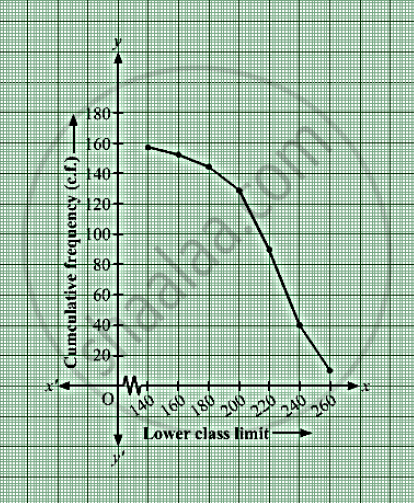
APPEARS IN
RELATED QUESTIONS
The monthly profits (in Rs.) of 100 shops are distributed as follows:
| Profits per shop: | 0 - 50 | 50 - 100 | 100 - 150 | 150 - 200 | 200 - 250 | 250 - 300 |
| No. of shops: | 12 | 18 | 27 | 20 | 17 | 6 |
Draw the frequency polygon for it.
The monthly pocket money of 50 students of a class are given in the following distribution
| Monthly pocket money (in Rs) | 0 - 50 | 50 – 100 | 100 – 150 | 150 -200 | 200 – 250 | 250 - 300 |
| Number of Students | 2 | 7 | 8 | 30 | 12 | 1 |
Find the modal class and give class mark of the modal class.
The following is the cumulative frequency distribution ( of less than type ) of 1000 persons each of age 20 years and above . Determine the mean age .
| Age below (in years): | 30 | 40 | 50 | 60 | 70 | 80 |
| Number of persons : | 100 | 220 | 350 | 750 | 950 | 1000 |
Write the median class for the following frequency distribution:
| Class-interval: | 0−10 | 10−20 | 20−30 | 30−40 | 40−50 | 50−60 | 60−70 | 70−80 |
| Frequency: | 5 | 8 | 7 | 12 | 28 | 20 | 10 | 10 |
In the formula `barx=a+h((sumf_iu_i)/(sumf_i))`, for finding the mean of grouped frequency distribution ui = ______.
The arithmetic mean of the following frequency distribution is 53. Find the value of k.
| Class | 0-20 | 20-40 | 40-60 | 60-80 | 80-100 |
| Frequency | 12 | 15 | 32 | k | 13 |
If the median of the following frequency distribution is 32.5. Find the values of f1 and f2.
| Class | 0-10 | 10-20 | 20-30 | 30-40 | 40-50 | 50-60 | 60-70 | Total |
| Frequency | f1 | 5 | 9 | 12 | f2 | 3 | 2 | 40 |
Change the following distribution to a 'more than type' distribution. Hence draw the 'more than type' ogive for this distribution.
| Class interval: | 20−30 | 30−40 | 40−50 | 50−60 | 60−70 | 70−80 | 80−90 |
| Frequency: | 10 | 8 | 12 | 24 | 6 | 25 | 15 |
Consider the following distribution:
| Marks obtained | Number of students |
| More than or equal to 0 | 63 |
| More than or equal to 10 | 58 |
| More than or equal to 20 | 55 |
| More than or equal to 30 | 51 |
| More than or equal to 40 | 48 |
| More than or equal to 50 | 42 |
The frequency of the class 30 – 40 is:
The following are the ages of 300 patients getting medical treatment in a hospital on a particular day:
| Age (in years) | 10 – 20 | 20 – 30 | 30 – 40 | 40 – 50 | 50 – 60 | 60 – 70 |
| Number of patients | 60 | 42 | 55 | 70 | 53 | 20 |
Form: Less than type cumulative frequency distribution.
