Advertisements
Advertisements
Question
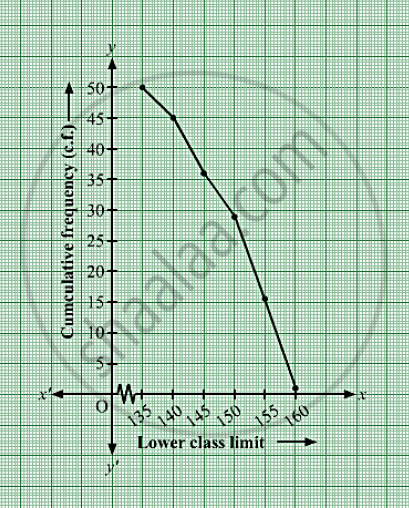
The heights of 50 girls of Class X of a school are recorded as follows:
| Height (in cm) | 135 - 140 | 140 – 145 | 145 – 150 | 150 – 155 | 155 – 160 | 160 – 165 |
| No of Students | 5 | 8 | 9 | 12 | 14 | 2 |
Draw a ‘more than type’ ogive for the above data.
Solution
The frequency distribution table of more than type is as follows:
| Height (in cm) (lower class limit | Cumulative frequency (cf) |
| More than 135 | 5 + 45 = 50 |
| More than 140 | 8 + 37 = 45 |
| More than 145 | 9 + 28 = 37 |
| More than 150 | 12 + 16 = 28 |
| More than 155 | 14 + 2 = 16 |
| More than 160 | 2 |
Taking lower class limits of on x-axis and their respective cumulative frequencies on y-axis,its ogive can be drawn as follows:
APPEARS IN
RELATED QUESTIONS
The following distribution gives the daily income of 50 workers of a factory.
| Daily income (in Rs | 100 − 120 | 120 − 140 | 140 − 160 | 160 − 180 | 180 − 200 |
| Number of workers | 12 | 14 | 8 | 6 | 10 |
Convert the distribution above to a less than type cumulative frequency distribution, and draw its ogive.
The monthly profits (in Rs.) of 100 shops are distributed as follows:
| Profits per shop: | 0 - 50 | 50 - 100 | 100 - 150 | 150 - 200 | 200 - 250 | 250 - 300 |
| No. of shops: | 12 | 18 | 27 | 20 | 17 | 6 |
Draw the frequency polygon for it.
The table given below shows the weekly expenditures on food of some households in a locality
| Weekly expenditure (in Rs) | Number of house holds |
| 100 – 200 | 5 |
| 200- 300 | 6 |
| 300 – 400 | 11 |
| 400 – 500 | 13 |
| 500 – 600 | 5 |
| 600 – 700 | 4 |
| 700 – 800 | 3 |
| 800 – 900 | 2 |
Draw a ‘less than type ogive’ and a ‘more than type ogive’ for this distribution.
Write the median class for the following frequency distribution:
| Class-interval: | 0−10 | 10−20 | 20−30 | 30−40 | 40−50 | 50−60 | 60−70 | 70−80 |
| Frequency: | 5 | 8 | 7 | 12 | 28 | 20 | 10 | 10 |
Consider the following frequency distribution :
| Class: | 0-5 | 6-11 | 12-17 | 18-23 | 24-29 |
| Frequency: | 13 | 10 | 15 | 8 | 11 |
The upper limit of the median class is
If the median of the following frequency distribution is 32.5. Find the values of f1 and f2.
For the following distribution:
| C.I. | 0 - 5 | 6 - 11 | 12 - 17 | 18 - 23 | 24 - 29 |
| f | 13 | 10 | 15 | 8 | 11 |
the upper limit of the median class is?
Consider the following distribution:
| Marks obtained | Number of students |
| More than or equal to 0 | 63 |
| More than or equal to 10 | 58 |
| More than or equal to 20 | 55 |
| More than or equal to 30 | 51 |
| More than or equal to 40 | 48 |
| More than or equal to 50 | 42 |
The frequency of the class 30 – 40 is:
Look at the following table below.
| Class interval | Classmark |
| 0 - 5 | A |
| 5 - 10 | B |
| 10 - 15 | 12.5 |
| 15 - 20 | 17.5 |
The value of A and B respectively are?
Given below is a cumulative frequency distribution showing the marks secured by 50 students of a class:
| Marks | Below 20 | Below 40 | Below 60 | Below 80 | Below 100 |
| Number of students | 17 | 22 | 29 | 37 | 50 |
Form the frequency distribution table for the data.
