Topics
Number Systems
Real Numbers
Algebra
Polynomials
Pair of Linear Equations in Two Variables
- Introduction to linear equations in two variables
- Graphical Method
- Substitution Method
- Elimination Method
- Cross - Multiplication Method
- Equations Reducible to a Pair of Linear Equations in Two Variables
- Consistency of Pair of Linear Equations
- Inconsistency of Pair of Linear Equations
- Algebraic Conditions for Number of Solutions
- Simple Situational Problems
- Pair of Linear Equations in Two Variables
- Relation Between Co-efficient
Quadratic Equations
- Quadratic Equations
- Solutions of Quadratic Equations by Factorization
- Solutions of Quadratic Equations by Completing the Square
- Nature of Roots of a Quadratic Equation
- Relationship Between Discriminant and Nature of Roots
- Situational Problems Based on Quadratic Equations Related to Day to Day Activities to Be Incorporated
- Application of Quadratic Equation
Arithmetic Progressions
Coordinate Geometry
Lines (In Two-dimensions)
Constructions
- Division of a Line Segment
- Construction of Tangents to a Circle
- Constructions Examples and Solutions
Geometry
Triangles
- Similar Figures
- Similarity of Triangles
- Basic Proportionality Theorem (Thales Theorem)
- Criteria for Similarity of Triangles
- Areas of Similar Triangles
- Right-angled Triangles and Pythagoras Property
- Similarity of Triangles
- Application of Pythagoras Theorem in Acute Angle and Obtuse Angle
- Triangles Examples and Solutions
- Concept of Angle Bisector
- Similarity of Triangles
- Ratio of Sides of Triangle
Circles
Trigonometry
Introduction to Trigonometry
- Trigonometry
- Trigonometry
- Trigonometric Ratios
- Trigonometric Ratios and Its Reciprocal
- Trigonometric Ratios of Some Special Angles
- Trigonometric Ratios of Complementary Angles
- Trigonometric Identities
- Proof of Existence
- Relationships Between the Ratios
Trigonometric Identities
Some Applications of Trigonometry
Mensuration
Areas Related to Circles
- Perimeter and Area of a Circle - A Review
- Areas of Sector and Segment of a Circle
- Areas of Combinations of Plane Figures
- Circumference of a Circle
- Area of Circle
Surface Areas and Volumes
- Surface Area of a Combination of Solids
- Volume of a Combination of Solids
- Conversion of Solid from One Shape to Another
- Frustum of a Cone
- Concept of Surface Area, Volume, and Capacity
- Surface Area and Volume of Different Combination of Solid Figures
- Surface Area and Volume of Three Dimensional Figures
Statistics and Probability
Statistics
Probability
Internal Assessment
Notes
In this concept we will study about Relation of Ogive and Median. These graphical representation of the frequency distribution are called Ogives. Actual limits are on the x-axis and cumulative frequencies on the y-axis.
Ogive is also known as cumulative frequency distribution.
You will be asked to draw either a less than frequency ogive or more than frequency ogive.
Example: The annual profits earned by 30 shops of a shopping complex in a locality give rise to the following distribution :
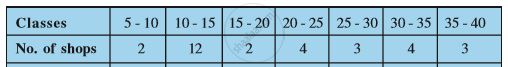
Convert the distribution above to a less than type cumulative frequency distribution and also to a more than type cumulative frequency distribution, and draw its ogive.
1) Less than type cumulative frequency table
|
Classes |
cf |
|
Less than 10 |
2 |
|
Less than 15 |
14 |
|
Less than 20 |
16 |
|
Less than 25 |
20 |
|
Less than 30 |
23 |
|
Less than 35 |
27 |
|
Less than 40 |
30
|
2) More than type cumulative frequency table
|
Classes |
cf |
|
More than 5 |
30 |
|
More than 10 |
28 |
|
More than 15 |
16 |
|
More than 20 |
14 |
|
More than 25 |
10 |
|
More than 30 |
7 |
|
More than 35 |
3 |
The graphical representation of both the ogives will be
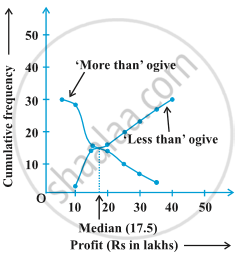
Here,
Now, we will take 15 on y axis and draw a perpendicular line that touches the curve, and from the point where the perpendicular touches the curve draw a perpendicular that touches the x axis, the point at which the perpendicular touches the x axis is the median.
Thus, here the Median is 17.5
