Advertisements
Advertisements
Question
The table given below shows the weekly expenditures on food of some households in a locality
| Weekly expenditure (in Rs) | Number of house holds |
| 100 – 200 | 5 |
| 200- 300 | 6 |
| 300 – 400 | 11 |
| 400 – 500 | 13 |
| 500 – 600 | 5 |
| 600 – 700 | 4 |
| 700 – 800 | 3 |
| 800 – 900 | 2 |
Draw a ‘less than type ogive’ and a ‘more than type ogive’ for this distribution.
Solution
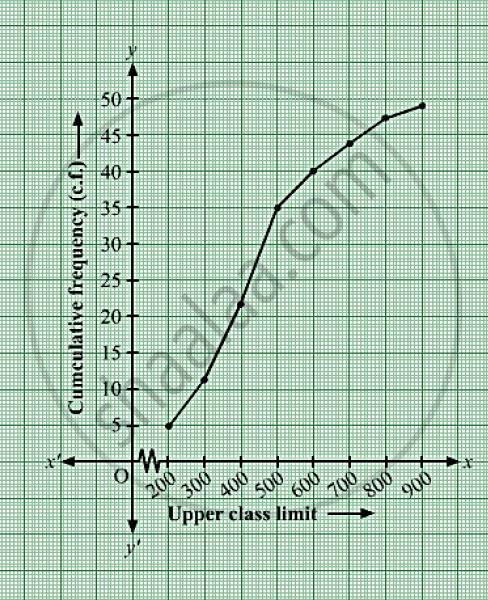
The frequency distribution table of less than type is as follows:
| Weekly expenditure (in Rs) (upper class limits) | Cumulative frequency (cf) |
| Less than 200 | 5 |
| Less than 300 | 5 + 6 = 11 |
| Less than 400 | 11 + 11 = 22 |
| Less than 500 | 22 + 13 = 35 |
| Less than 600 | 35 + 5 = 40 |
| Less than 700 | 40 + 4 = 44 |
| Less than 800 | 44 + 3 = 47 |
| Less than 900 | 47 + 2 = 49 |
Taking the lower class limits on x-axis and their respective cumulative frequencies on y-axis, its ogive can be obtained as follows
Now,
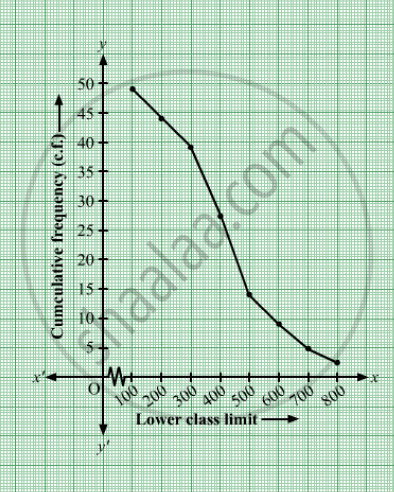
The frequency distribution table of more than type is as follows:
| Weekly expenditure (in Rs) (lower class limits) | Cumulative frequency (cf) |
| More than 100 | 44 + 5 = 49 |
| More than 200 | 38 + 6 = 44 |
| More than 300 | 27 + 11 = 38 |
| More than 400 | 14 + 13 = 27 |
| More than 500 | 9 + 5 = 14 |
| More than 600 | 5 + 4 = 9 |
| More than 700 | 2 + 3 = 5 |
| More than 800 | 2 |
Taking the lower class limits
on x-axis and their respective
cumulative frequencies on y-axis,
its ogive can be obtained as follows:
APPEARS IN
RELATED QUESTIONS
During the medical check-up of 35 students of a class, their weights were recorded as follows:
| Weight (in kg | Number of students |
| Less than 38 | 0 |
| Less than 40 | 3 |
| Less than 42 | 5 |
| Less than 44 | 9 |
| Less than 46 | 14 |
| Less than 48 | 28 |
| Less than 50 | 32 |
| Less than 52 | 35 |
Draw a less than type ogive for the given data. Hence obtain the median weight from the graph verify the result by using the formula.
The monthly profits (in Rs.) of 100 shops are distributed as follows:
| Profits per shop: | 0 - 50 | 50 - 100 | 100 - 150 | 150 - 200 | 200 - 250 | 250 - 300 |
| No. of shops: | 12 | 18 | 27 | 20 | 17 | 6 |
Draw the frequency polygon for it.
From the following frequency, prepare the ‘more than’ ogive.
| Score | Number of candidates |
| 400 – 450 | 20 |
| 450 – 500 | 35 |
| 500 – 550 | 40 |
| 550 – 600 | 32 |
| 600 – 650 | 24 |
| 650 – 700 | 27 |
| 700 – 750 | 18 |
| 750 – 800 | 34 |
| Total | 230 |
Also, find the median.
The marks obtained by 100 students of a class in an examination are given below:
| Marks | Number of students |
| 0 – 5 | 2 |
| 5 – 10 | 5 |
| 10 – 15 | 6 |
| 15 – 20 | 8 |
| 20 – 25 | 10 |
| 25 – 30 | 25 |
| 30 – 35 | 20 |
| 35 – 40 | 18 |
| 40 – 45 | 4 |
| 45 – 50 | 2 |
Draw cumulative frequency curves by using (i) ‘less than’ series and (ii) ‘more than’ series.Hence, find the median.
The monthly pocket money of 50 students of a class are given in the following distribution
| Monthly pocket money (in Rs) | 0 - 50 | 50 – 100 | 100 – 150 | 150 -200 | 200 – 250 | 250 - 300 |
| Number of Students | 2 | 7 | 8 | 30 | 12 | 1 |
Find the modal class and give class mark of the modal class.
The following is the cumulative frequency distribution ( of less than type ) of 1000 persons each of age 20 years and above . Determine the mean age .
| Age below (in years): | 30 | 40 | 50 | 60 | 70 | 80 |
| Number of persons : | 100 | 220 | 350 | 750 | 950 | 1000 |
Consider the following frequency distributions
| Class | 65 - 85 | 85 - 105 | 105 - 125 | 125 - 145 | 145 - 165 | 165 - 185 | 185-205 |
| Frequency | 4 | 5 | 13 | 20 | 14 | 7 | 4 |
The difference of the upper limit of the median class and the lower limit of the modal class is?
Find the mode of the following frequency distribution.
| Class | 0-10 | 10-20 | 20-30 | 30-40 | 40-50 | 50-60 | 60-70 |
| Frequency | 8 | 10 | 10 | 16 | 12 | 6 | 7 |
For one term, absentee record of students is given below. If mean is 15.5, then the missing frequencies x and y are.
| Number of days | 0 - 5 | 5 - 10 | 10 - 15 | 15 - 20 | 20 - 25 | 25 - 30 | 30 - 35 | 35 - 40 | TOTAL |
| Total Number of students | 15 | 16 | x | 8 | y | 8 | 6 | 4 | 70 |
Given below is a cumulative frequency distribution showing the marks secured by 50 students of a class:
| Marks | Below 20 | Below 40 | Below 60 | Below 80 | Below 100 |
| Number of students | 17 | 22 | 29 | 37 | 50 |
Form the frequency distribution table for the data.
