Advertisements
Advertisements
Question
From the following frequency, prepare the ‘more than’ ogive.
| Score | Number of candidates |
| 400 – 450 | 20 |
| 450 – 500 | 35 |
| 500 – 550 | 40 |
| 550 – 600 | 32 |
| 600 – 650 | 24 |
| 650 – 700 | 27 |
| 700 – 750 | 18 |
| 750 – 800 | 34 |
| Total | 230 |
Also, find the median.
Solution
From the given table, we may prepare than ‘more than’ frequency table as shown below:
| Score | Number of candidates |
| More than 750 | 34 |
| More than 700 | 52 |
| More than 650 | 79 |
| More than 600 | 103 |
| More than 550 | 135 |
| More than 500 | 175 |
| More than 450 | 210 |
| More than 400 | 230 |
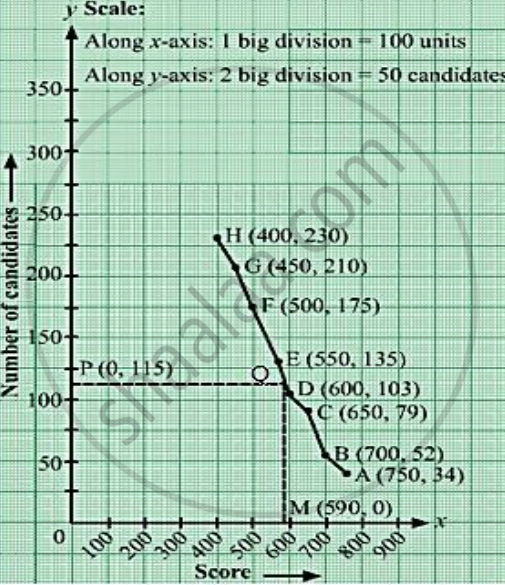
We plot the points A(750, 34), B(700,52),
C(650, 79), D(600, 103), E(550, 135), F(500, 175),
G(450, 210) and H(400, 230).
Join AB, BC, CD, DE, EF, FG, GH and HA with
a free hand to get the curve representing the
‘more than type’ series.

Here, N = 230
⇒ `N/2 = 115`
From P (0, 115), draw PQ meeting the curve at Q. Draw QM meeting at M.
Clearly, OM = 590 units
Hence, median = 590 units.
APPEARS IN
RELATED QUESTIONS
The monthly profits (in Rs.) of 100 shops are distributed as follows:
| Profits per shop: | 0 - 50 | 50 - 100 | 100 - 150 | 150 - 200 | 200 - 250 | 250 - 300 |
| No. of shops: | 12 | 18 | 27 | 20 | 17 | 6 |
Draw the frequency polygon for it.
Write the median class of the following distribution:
| Class | 0 – 10 | 10 -20 | 20- 30 | 30- 40 | 40-50 | 50- 60 | 60- 70 |
| Frequency | 4 | 4 | 8 | 10 | 12 | 8 | 4 |
Write the modal class for the following frequency distribution:
| Class-interval: | 10−15 | 15−20 | 20−25 | 25−30 | 30−35 | 35−40 |
| Frequency: | 30 | 35 | 75 | 40 | 30 | 15 |
For a frequency distribution, mean, median and mode are connected by the relation
The mean of a discrete frequency distribution xi / fi, i = 1, 2, ......, n is given by
Consider the following frequency distribution :
| Class: | 0-5 | 6-11 | 12-17 | 18-23 | 24-29 |
| Frequency: | 13 | 10 | 15 | 8 | 11 |
The upper limit of the median class is
If the median of the following frequency distribution is 32.5. Find the values of f1 and f2.
For one term, absentee record of students is given below. If mean is 15.5, then the missing frequencies x and y are.
| Number of days | 0 - 5 | 5 - 10 | 10 - 15 | 15 - 20 | 20 - 25 | 25 - 30 | 30 - 35 | 35 - 40 | TOTAL |
| Total Number of students | 15 | 16 | x | 8 | y | 8 | 6 | 4 | 70 |
For the following distribution:
| C.I. | 0 - 5 | 6 - 11 | 12 - 17 | 18 - 23 | 24 - 29 |
| f | 13 | 10 | 15 | 8 | 11 |
the upper limit of the median class is?
Form the frequency distribution table from the following data:
| Marks (out of 90) | Number of candidates |
| More than or equal to 80 | 4 |
| More than or equal to 70 | 6 |
| More than or equal to 60 | 11 |
| More than or equal to 50 | 17 |
| More than or equal to 40 | 23 |
| More than or equal to 30 | 27 |
| More than or equal to 20 | 30 |
| More than or equal to 10 | 32 |
| More than or equal to 0 | 34 |
