Advertisements
Advertisements
प्रश्न
From the following frequency, prepare the ‘more than’ ogive.
| Score | Number of candidates |
| 400 – 450 | 20 |
| 450 – 500 | 35 |
| 500 – 550 | 40 |
| 550 – 600 | 32 |
| 600 – 650 | 24 |
| 650 – 700 | 27 |
| 700 – 750 | 18 |
| 750 – 800 | 34 |
| Total | 230 |
Also, find the median.
उत्तर
From the given table, we may prepare than ‘more than’ frequency table as shown below:
| Score | Number of candidates |
| More than 750 | 34 |
| More than 700 | 52 |
| More than 650 | 79 |
| More than 600 | 103 |
| More than 550 | 135 |
| More than 500 | 175 |
| More than 450 | 210 |
| More than 400 | 230 |
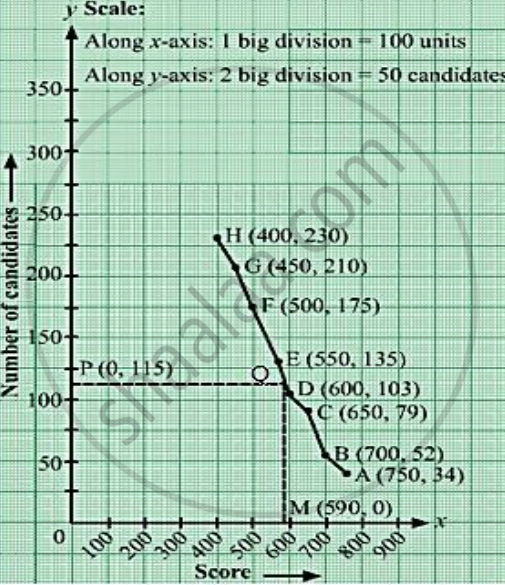
We plot the points A(750, 34), B(700,52),
C(650, 79), D(600, 103), E(550, 135), F(500, 175),
G(450, 210) and H(400, 230).
Join AB, BC, CD, DE, EF, FG, GH and HA with
a free hand to get the curve representing the
‘more than type’ series.

Here, N = 230
⇒ `N/2 = 115`
From P (0, 115), draw PQ meeting the curve at Q. Draw QM meeting at M.
Clearly, OM = 590 units
Hence, median = 590 units.
APPEARS IN
संबंधित प्रश्न
Find the median of the following data by making a ‘less than ogive’.
| Marks | 0 - 10 | 10-20 | 20 - 30 | 30 - 40 | 40 - 50 | 50 - 60 | 60 - 70 | 70 - 80 | 80-90 | 90-100 |
| Number of Students | 5 | 3 | 4 | 3 | 3 | 4 | 7 | 9 | 7 | 8 |
The following table gives the production yield per hectare of wheat of 100 farms of a village.
| Production Yield (kg/ha) | 50 –55 | 55 –60 | 60 –65 | 65- 70 | 70 – 75 | 75 80 |
| Number of farms | 2 | 8 | 12 | 24 | 238 | 16 |
Change the distribution to a ‘more than type’ distribution and draw its ogive. Using ogive, find the median of the given data.
The marks obtained by 100 students of a class in an examination are given below:
| Marks | Number of students |
| 0 – 5 | 2 |
| 5 – 10 | 5 |
| 10 – 15 | 6 |
| 15 – 20 | 8 |
| 20 – 25 | 10 |
| 25 – 30 | 25 |
| 30 – 35 | 20 |
| 35 – 40 | 18 |
| 40 – 45 | 4 |
| 45 – 50 | 2 |
Draw cumulative frequency curves by using (i) ‘less than’ series and (ii) ‘more than’ series.Hence, find the median.
Write the median class of the following distribution:
| Class | 0 – 10 | 10 -20 | 20- 30 | 30- 40 | 40-50 | 50- 60 | 60- 70 |
| Frequency | 4 | 4 | 8 | 10 | 12 | 8 | 4 |
Write the modal class for the following frequency distribution:
| Class-interval: | 10−15 | 15−20 | 20−25 | 25−30 | 30−35 | 35−40 |
| Frequency: | 30 | 35 | 75 | 40 | 30 | 15 |
If \[u_i = \frac{x_i - 25}{10}, \Sigma f_i u_i = 20, \Sigma f_i = 100, \text { then }\]`overlineX`
If the median of the following frequency distribution is 32.5. Find the values of f1 and f2.
Change the following distribution to a 'more than type' distribution. Hence draw the 'more than type' ogive for this distribution.
| Class interval: | 20−30 | 30−40 | 40−50 | 50−60 | 60−70 | 70−80 | 80−90 |
| Frequency: | 10 | 8 | 12 | 24 | 6 | 25 | 15 |
For one term, absentee record of students is given below. If mean is 15.5, then the missing frequencies x and y are.
| Number of days | 0 - 5 | 5 - 10 | 10 - 15 | 15 - 20 | 20 - 25 | 25 - 30 | 30 - 35 | 35 - 40 | TOTAL |
| Total Number of students | 15 | 16 | x | 8 | y | 8 | 6 | 4 | 70 |
Consider the following distribution:
| Marks obtained | Number of students |
| More than or equal to 0 | 63 |
| More than or equal to 10 | 58 |
| More than or equal to 20 | 55 |
| More than or equal to 30 | 51 |
| More than or equal to 40 | 48 |
| More than or equal to 50 | 42 |
The frequency of the class 30 – 40 is:
