Advertisements
Advertisements
Question
The following table gives the production yield per hectare of wheat of 100 farms of a village.
| Production Yield (kg/ha) | 50 –55 | 55 –60 | 60 –65 | 65- 70 | 70 – 75 | 75 80 |
| Number of farms | 2 | 8 | 12 | 24 | 238 | 16 |
Change the distribution to a ‘more than type’ distribution and draw its ogive. Using ogive, find the median of the given data.
Solution
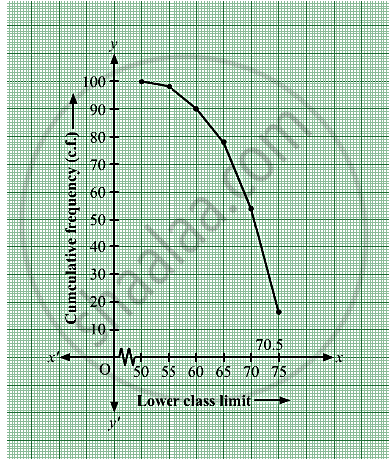
The frequency distribution table of more than type is as follows:
| Production yield (kg/ha) (lower class limits) | Cumulative frequency (cf) |
| More than 50 | 2 + 98 = 100 |
| More than 55 | 8 + 90 = 98 |
| More than 60 | 12 + 78 = 90 |
| More than 65 | 24 + 54 = 78 |
| More than 70 | 38 + 16 = 54 |
| More than 75 | 16 |
Taking the lower class limits on x-axis and their respective cumulative on y-axis, its ogive can be drawn as follows
Here, N = 100 ⇒ `N/2 = 50.`
Mark the point A whose ordinate is 50 and its x-coordinate is 70.5.
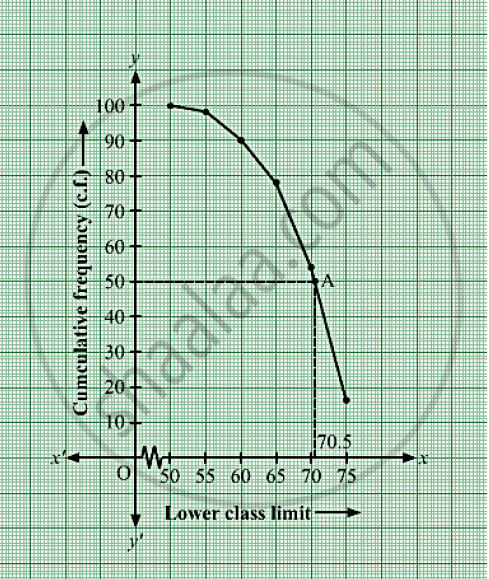
Thus, median of the data is 70.5.
APPEARS IN
RELATED QUESTIONS
The monthly profits (in Rs.) of 100 shops are distributed as follows:
| Profits per shop: | 0 - 50 | 50 - 100 | 100 - 150 | 150 - 200 | 200 - 250 | 250 - 300 |
| No. of shops: | 12 | 18 | 27 | 20 | 17 | 6 |
Draw the frequency polygon for it.
The table given below shows the weekly expenditures on food of some households in a locality
| Weekly expenditure (in Rs) | Number of house holds |
| 100 – 200 | 5 |
| 200- 300 | 6 |
| 300 – 400 | 11 |
| 400 – 500 | 13 |
| 500 – 600 | 5 |
| 600 – 700 | 4 |
| 700 – 800 | 3 |
| 800 – 900 | 2 |
Draw a ‘less than type ogive’ and a ‘more than type ogive’ for this distribution.
The following table gives the life-time (in days) of 100 electric bulbs of a certain brand.
| Life-tine (in days) | Less than 50 |
Less than 100 |
Less than 150 |
Less than 200 |
Less than 250 |
Less than 300 |
| Number of Bulbs | 7 | 21 | 52 | 9 | 91 | 100 |
In the formula `barx=a+h((sumf_iu_i)/(sumf_i))`, for finding the mean of grouped frequency distribution ui = ______.
Find the mode of the following frequency distribution.
| Class | 0-10 | 10-20 | 20-30 | 30-40 | 40-50 | 50-60 | 60-70 |
| Frequency | 8 | 10 | 10 | 16 | 12 | 6 | 7 |
For one term, absentee record of students is given below. If mean is 15.5, then the missing frequencies x and y are.
| Number of days | 0 - 5 | 5 - 10 | 10 - 15 | 15 - 20 | 20 - 25 | 25 - 30 | 30 - 35 | 35 - 40 | TOTAL |
| Total Number of students | 15 | 16 | x | 8 | y | 8 | 6 | 4 | 70 |
For the following distribution:
| C.I. | 0 - 5 | 6 - 11 | 12 - 17 | 18 - 23 | 24 - 29 |
| f | 13 | 10 | 15 | 8 | 11 |
the upper limit of the median class is?
Consider the following distribution:
| Marks obtained | Number of students |
| More than or equal to 0 | 63 |
| More than or equal to 10 | 58 |
| More than or equal to 20 | 55 |
| More than or equal to 30 | 51 |
| More than or equal to 40 | 48 |
| More than or equal to 50 | 42 |
The frequency of the class 30 – 40 is:
The following is the distribution of weights (in kg) of 40 persons:
| Weight (in kg) | 40 – 45 | 45 – 50 | 50 – 55 | 55 – 60 | 60 – 65 | 65 – 70 | 70 – 75 | 75 – 80 |
| Number of persons | 4 | 4 | 13 | 5 | 6 | 5 | 2 | 1 |
Construct a cumulative frequency distribution (of the less than type) table for the data above.
Find the unknown entries a, b, c, d, e, f in the following distribution of heights of students in a class:
| Height (in cm) |
Frequency | Cumulative frequency |
| 150 – 155 | 12 | a |
| 155 – 160 | b | 25 |
| 160 – 165 | 10 | c |
| 165 – 170 | d | 43 |
| 170 – 175 | e | 48 |
| 175 – 180 | 2 | f |
| Total | 50 |
