Advertisements
Advertisements
प्रश्न
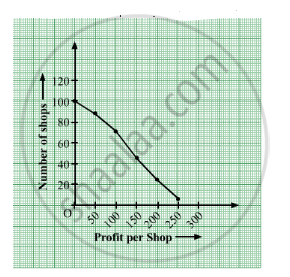
The monthly profits (in Rs.) of 100 shops are distributed as follows:
| Profits per shop: | 0 - 50 | 50 - 100 | 100 - 150 | 150 - 200 | 200 - 250 | 250 - 300 |
| No. of shops: | 12 | 18 | 27 | 20 | 17 | 6 |
Draw the frequency polygon for it.
उत्तर
Firstly, we make a cumulative frequency table.
| Profit per shop | No. of shop | More than profit | Cumulative frequency | Suitable points |
| 0-50 | 12 | 0 | 100 | (0, 100) |
| 50-100 | 18 | 50 | 88 | (50, 88) |
| 100-150 | 27 | 100 | 70 | (100, 70) |
| 150-200 | 20 | 150 | 43 | (150, 43) |
| 200-250 | 17 | 200 | 23 | (200, 23) |
| 250-300 | 6 | 250 | 6 | (250, 6) |
Now, plot the frequency polygon (or more than ogive) using suitable points.

APPEARS IN
संबंधित प्रश्न
During the medical check-up of 35 students of a class, their weights were recorded as follows:
| Weight (in kg | Number of students |
| Less than 38 | 0 |
| Less than 40 | 3 |
| Less than 42 | 5 |
| Less than 44 | 9 |
| Less than 46 | 14 |
| Less than 48 | 28 |
| Less than 50 | 32 |
| Less than 52 | 35 |
Draw a less than type ogive for the given data. Hence obtain the median weight from the graph verify the result by using the formula.
The following table gives production yield per hectare of wheat of 100 farms of a village.
| Production yield (in kg/ha) | 50 − 55 | 55 − 60 | 60 − 65 | 65 − 70 | 70 − 75 | 75 − 80 |
| Number of farms | 2 | 8 | 12 | 24 | 38 | 16 |
Change the distribution to a more than type distribution and draw ogive.
Draw a ‘more than’ ogive for the data given below which gives the marks of 100 students.
| Marks | 0 – 10 | 10 – 20 | 20 – 30 | 30 - 40 | 40 – 50 | 50 – 60 | 60 – 70 | 70 – 80 |
| No of Students | 4 | 6 | 10 | 10 | 25 | 22 | 18 | 5 |
From the following data, draw the two types of cumulative frequency curves and determine the median:
| Marks | Frequency |
| 140 – 144 | 3 |
| 144 – 148 | 9 |
| 148 – 152 | 24 |
| 152 – 156 | 31 |
| 156 – 160 | 42 |
| 160 – 164 | 64 |
| 164 – 168 | 75 |
| 168 – 172 | 82 |
| 172 – 176 | 86 |
| 176 – 180 | 34 |
Write the median class of the following distribution:
| Class | 0 – 10 | 10 -20 | 20- 30 | 30- 40 | 40-50 | 50- 60 | 60- 70 |
| Frequency | 4 | 4 | 8 | 10 | 12 | 8 | 4 |
Consider the following frequency distributions
| Class | 65 - 85 | 85 - 105 | 105 - 125 | 125 - 145 | 145 - 165 | 165 - 185 | 185-205 |
| Frequency | 4 | 5 | 13 | 20 | 14 | 7 | 4 |
The difference of the upper limit of the median class and the lower limit of the modal class is?
The arithmetic mean of the following frequency distribution is 53. Find the value of k.
| Class | 0-20 | 20-40 | 40-60 | 60-80 | 80-100 |
| Frequency | 12 | 15 | 32 | k | 13 |
Change the following distribution to a 'more than type' distribution. Hence draw the 'more than type' ogive for this distribution.
| Class interval: | 20−30 | 30−40 | 40−50 | 50−60 | 60−70 | 70−80 | 80−90 |
| Frequency: | 10 | 8 | 12 | 24 | 6 | 25 | 15 |
The following is the distribution of weights (in kg) of 40 persons:
| Weight (in kg) | 40 – 45 | 45 – 50 | 50 – 55 | 55 – 60 | 60 – 65 | 65 – 70 | 70 – 75 | 75 – 80 |
| Number of persons | 4 | 4 | 13 | 5 | 6 | 5 | 2 | 1 |
Construct a cumulative frequency distribution (of the less than type) table for the data above.
The following are the ages of 300 patients getting medical treatment in a hospital on a particular day:
| Age (in years) | 10 – 20 | 20 – 30 | 30 – 40 | 40 – 50 | 50 – 60 | 60 – 70 |
| Number of patients | 60 | 42 | 55 | 70 | 53 | 20 |
Form: More than type cumulative frequency distribution.
