Advertisements
Advertisements
प्रश्न
An incomplete distribution is given as follows:
| Variable: | 0 - 10 | 10 - 20 | 20 - 30 | 30 - 40 | 40 - 50 | 50 - 60 | 60 - 70 |
| Frequency: | 10 | 20 | ? | 40 | ? | 25 | 15 |
You are given that the median value is 35 and the sum of all the frequencies is 170. Using the median formula, fill up the missing frequencies.
उत्तर
| Class interval | Frequency | Cumulative frequency |
| 0 - 10 | 10 | 10 |
| 10 - 20 | 20 | 30 |
| 20 - 30 | f1 | 30 + f1 |
| 30 - 40 | 40 | 70 + f1 |
| 40 - 50 | f2 | 70 + f1 + f2 |
| 50 - 60 | 25 | 95 + f1 + f2 |
| 60 - 70 | 15 | 110 + f1 + f2 |
| N = 170 |
Given median = 35
The median class = 30 - 40
l = 30, h = 40 - 30 = 10, f = 40, F = 30 + f1
Median `=l+{(N/2-F)/f}xxh`
`35=30+{(85-(30 + f1))/40}xx10`
`35=30+(55-f1)/40xx10`
`35-30=(55-f1)/4`
`5=(55-f1)/4`
5 x 4 = 55 - f1
20 = 55 - f1
f1 = 55 - 20
f1 = 35
Given
Sum of frequencies = 170
⇒ 10 + 20 + f1 + 40 + f2 + 25+ 15 = 170
⇒ 10 + 20 + 35 + 40 + f2 + 25+ 15 = 170
⇒ 145 + f2 = 170
⇒ f2 = 170 - 145
⇒ f2 = 25
∴ f1 = 35 and f2 = 25
APPEARS IN
संबंधित प्रश्न
The distribution below gives the weights of 30 students of a class. Find the median weight of the students.
| Weight (in kg) | 40−45 | 45−50 | 50−55 | 55−60 | 60−65 | 65−70 | 70−75 |
| Number of students | 2 | 3 | 8 | 6 | 6 | 3 | 2 |
Calculate the missing frequency from the following distribution, it being given that the median of the distribution is 24.
| Age in years | 0 - 10 | 10 - 20 | 20 - 30 | 30 - 40 | 40 - 50 |
| No. of persons | 5 | 25 | ? | 18 | 7 |
The median of the following data is 525. Find the missing frequency, if it is given that there are 100 observations in the data:
| Class interval | Frequency |
| 0 - 100 | 2 |
| 100 - 200 | 5 |
| 200 - 300 | f1 |
| 300 - 400 | 12 |
| 400 - 500 | 17 |
| 500 - 600 | 20 |
| 600 - 700 | f2 |
| 700 - 800 | 9 |
| 800 - 900 | 7 |
| 900 - 1000 | 4 |
If the median of the following data is 32.5, find the missing frequencies.
| Class interval: | 0 - 10 | 10 - 20 | 20 - 30 | 30 - 40 | 40 - 50 | 50 - 60 | 60 - 70 | Total |
| Frequency: | f1 | 5 | 9 | 12 | f2 | 3 | 2 | 40 |
Compute the median for the following data:
| Marks | No. of students |
| Less than 10 | 0 |
| Less than 30 | 10 |
| Less than 50 | 25 |
| Less than 70 | 43 |
| Less than 90 | 65 |
| Less than 110 | 87 |
| Less than 130 | 96 |
| Less than 150 | 100 |
Calculate the median from the following data:
| Height(in cm) | 135 - 140 | 140 - 145 | 145 - 150 | 150 - 155 | 155 - 160 | 160 - 165 | 165 - 170 | 170 - 175 |
| Frequency | 6 | 10 | 18 | 22 | 20 | 15 | 6 | 3 |
The following table shows the number of patients of different age groups admitted to a hospital for treatment on a day. Find the median of ages of the patients.
| Age- group (Yrs.) | 10-20 | 20-30 | 30-40 | 40-50 | 50-60 | 60-70 |
| No. of patients | 40 | 32 | 35 | 45 | 33 | 15 |
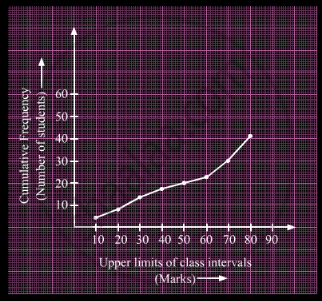
A student draws a cumulative frequency curve for the marks obtained by 40 students of a class as shown below. Find the median marks obtained by the students of the class.

Calculate the median of the following distribution:
| No. of goals | 0 | 1 | 2 | 3 | 4 | 5 |
| No. of matches | 2 | 4 | 7 | 6 | 8 | 3 |
The following table gives the monthly consumption of electricity of 100 families:
| Monthly Consumption (in units) |
130 – 140 | 140 – 150 | 150 – 160 | 160 – 170 | 170 – 180 | 180 – 190 | 190 – 200 |
| Number of families |
5 | 9 | 17 | 28 | 24 | 10 | 7 |
Find the median of the above data.
