Advertisements
Advertisements
प्रश्न
In a hospital, the ages of diabetic patients were recorded as follows. Find the median age.
| Age (in years) |
0 – 15 | 15 – 30 | 30 – 45 | 45 – 60 | 60 - 75 |
| No. of patients | 5 | 20 | 40 | 50 | 25 |
उत्तर
We prepare the cumulative frequency table, as shown below:
| Age (in years) | Number of patients `(f_i)` | Cumulative Frequency (cf) |
| 0 – 15 | 5 | 5 |
| 15 – 30 | 20 | 25 |
| 30 – 45 | 40 | 65 |
| 45 – 60 | 50 | 115 |
| 60 – 75 | 25 | 140 |
| Total | `N = Σ f_i` = 140 |
Now, N = 140 ⇒`N/2 = 70`
The cumulative frequency just greater than 70 is 115 and the corresponding class is 45 –60
Thus, the median class is 45 – 60.
∴ l = 45, h = 15, f = 50, N = 140 and cf = 65.
Now,
Median = l + `((N/2-cf)/f) xx h`
=`45 + ((140/2-65)/50) xx 15`
=`45+((70-65)/50) xx 15`
= 45 + 1.5
= 46.5
Hence, the median age is 46.5 years.
APPEARS IN
संबंधित प्रश्न
Below is the given frequency distribution of words in an essay
| Number of Words | Number of Candidates |
| 600 – 800 | 8 |
| 800 – 1000 | 22 |
| 1000 – 1200 | 40 |
| 1200 – 1400 | 18 |
| 1400 - 1600 | 12 |
Find the mean number of words written.
If `sumf_ix_i=75 and sumfi=15` , then find the mean x .
For a certain frequency distribution, the value of mean is 20 and mode is 11. Find the value of median.
The weight of 60 boys are given in the following distribution table:
| Weight (kg) | 37 | 38 | 39 | 40 | 41 |
| No. of boys | 10 | 14 | 18 | 12 | 6 |
Find:
- Median
- Lower quartile
- Upper quartile
- Inter-quartile range
Calculate the median from the following data:
| Height(in cm) | 135 - 140 | 140 - 145 | 145 - 150 | 150 - 155 | 155 - 160 | 160 - 165 | 165 - 170 | 170 - 175 |
| Frequency | 6 | 10 | 18 | 22 | 20 | 15 | 6 | 3 |
The following table shows the information regarding the milk collected from farmers on a milk collection centre and the content of fat in the milk, measured by a lactometer. Find the mode of fat content.
| Content of fat (%) | 2 - 3 | 3 - 4 | 4 - 5 | 5 - 6 | 6 - 7 |
| Milk collected (Litre) | 30 | 70 | 80 | 60 | 20 |
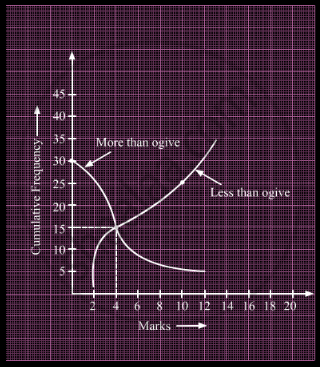
What is the value of the median of the data using the graph in the following figure of less than ogive and more than ogive?

The median of the following data is 525. Find the values of x and y, if the total frequency is 100.
| Class interval | Frequency |
| 0 – 100 | 2 |
| 100 – 200 | 5 |
| 200 – 300 | x |
| 300 – 400 | 12 |
| 400 – 500 | 17 |
| 500 – 600 | 20 |
| 600 – 700 | y |
| 700 – 800 | 9 |
| 800 – 900 | 7 |
| 900 – 1000 | 4 |
Find the median of the following distribution:
| Marks | 0 – 10 | 10 –20 | 20 – 30 | 30 – 40 | 40 – 50 | 50 – 60 |
| Number of students | 5 | 8 | 20 | 15 | 7 | 5 |
Find the median of the following frequency distribution:
| Class: | 0 – 20 | 20 – 40 | 40 – 60 | 60 – 80 | 80 – 100 |
| Frequency: | 6 | 8 | 5 | 9 | 7 |
