Advertisements
Advertisements
प्रश्न
If the median of the following frequency distribution is 32.5, find the values of `f_1 and f_2`.
| Class | 0 – 10 | 10 – 20 | 20 – 30 | 30 -40 | 40 – 50 | 50 – 60 | 60 – 70 | Total |
| Frequency | `f_1` |
5 |
9 | 12 | `f_2` | 3 | 2 | 40 |
उत्तर
| Class | Frequency (f) | Cumulative Frequency (cf) |
| 0 – 10 | `f_1` | `f_1` |
| 10 – 20 | 5 | `f_1`+5 |
| 20 – 30 | 9 | `f_1`+14 |
| 30 – 40 | 12 | `f_1`+26 |
| 40 – 50 | `f_2` | `f_1`+`f_2`+26 |
| 50 – 60 | 3 | `f_1`+`f_2`+29 |
| 60 – 70 | 2 | `f_1`+`f_2`+31 |
| N = Σ𝑓 = 40 |
Now,` f_1 + f_2 + 31 = 40`
⇒` f_1 + f_2 = 9`
⇒ `f_2 = 9 - f_1`
The median is 32.5 which lies in 30 – 40.
Hence, median class = 30 – 40
Here, `l = 30, N/2 = 40/2 = 20, f = 12 and cf = 14 + f_1`
Now, median = 32.5
`⇒ l + ((N/2−Cf)/f) × h = 32.5`
`⇒ 30 + ((20 −(14 + f1))/ 12)× 10 = 32.5`
`⇒ (6 − f_1)/ 12` × 10 = 2.5
`⇒ (60 − 10f_1)/12 = 2.5`
`⇒ 60 – 10f_1 = 30`
`⇒ 10f_1 = 30`
`⇒ f_1 = 3`
From equation (i), we have:
`f_2 = 9 – 3`
`⇒ f_2 = 6`
संबंधित प्रश्न
Following are the lives in hours of 15 pieces of the components of aircraft engine. Find the median:
715, 724, 725, 710, 729, 745, 694, 699, 696, 712, 734, 728, 716, 705, 719.
The following is the distribution of height of students of a certain class in a certain city:
| Height (in cm): | 160 - 162 | 163 - 165 | 166 - 168 | 169 - 171 | 172 - 174 |
| No. of students: | 15 | 118 | 142 | 127 | 18 |
Find the median height.
If the median of the following data is 32.5, find the missing frequencies.
| Class interval: | 0 - 10 | 10 - 20 | 20 - 30 | 30 - 40 | 40 - 50 | 50 - 60 | 60 - 70 | Total |
| Frequency: | f1 | 5 | 9 | 12 | f2 | 3 | 2 | 40 |
A survey regarding the height (in cm) of 51 girls of class X of a school was conducted and the following data was obtained:
| Height in cm | Number of Girls |
| Less than 140 | 4 |
| Less than 145 | 11 |
| Less than 150 | 29 |
| Less than 155 | 40 |
| Less than 160 | 46 |
| Less than 165 | 51 |
Find the median height.
In a hospital, the ages of diabetic patients were recorded as follows. Find the median age.
| Age (in years) |
0 – 15 | 15 – 30 | 30 – 45 | 45 – 60 | 60 - 75 |
| No. of patients | 5 | 20 | 40 | 50 | 25 |
Calculate the median from the following data:
| Height(in cm) | 135 - 140 | 140 - 145 | 145 - 150 | 150 - 155 | 155 - 160 | 160 - 165 | 165 - 170 | 170 - 175 |
| Frequency | 6 | 10 | 18 | 22 | 20 | 15 | 6 | 3 |
The following frequency distribution table shows the number of mango trees in a grove and their yield of mangoes, and also the cumulative frequencies. Find the median of the data.
| Class (No. of mangoes) |
Frequency (No. of trees) |
Cumulative frequency (less than) |
| 50-100 | 33 | 33 |
| 100-150 | 30 | 63 |
| 150-200 | 90 | 153 |
| 200-250 | 80 | 233 |
| 250-300 | 17 | 250 |
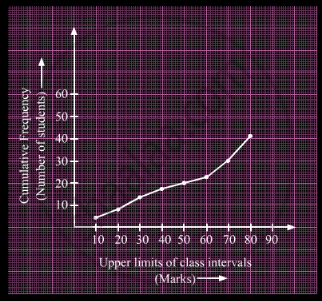
A student draws a cumulative frequency curve for the marks obtained by 40 students of a class as shown below. Find the median marks obtained by the students of the class.

For the following distribution
| Marks | 0 - 10 | 10 - 20 | 20 - 30 | 30 - 40 | 40 - 50 |
| No. of Students | 3 | 9 | 13 | 10 | 5 |
the number of students who got marks less than 30 is?
Find the median of the following distribution:
| Marks | 0 – 10 | 10 –20 | 20 – 30 | 30 – 40 | 40 – 50 | 50 – 60 |
| Number of students | 5 | 8 | 20 | 15 | 7 | 5 |
