Advertisements
Advertisements
प्रश्न
The weights (in kg) of 10 students of a class are given below:
21, 28.5, 20.5, 24, 25.5, 22, 27.5, 28, 21 and 24.
Find the median of their weights.
उत्तर
Arranging the given data in descending order:
28.5, 28, 27.5, 25.5, 24, 24, 22, 21, 21, 20.5
The middle terms are 24 and 24, 5th and 6th terms
∴ Median = `(24 + 24)/2`
= `48/2`
= 24
APPEARS IN
संबंधित प्रश्न
Below is the given frequency distribution of words in an essay
| Number of Words | Number of Candidates |
| 600 – 800 | 8 |
| 800 – 1000 | 22 |
| 1000 – 1200 | 40 |
| 1200 – 1400 | 18 |
| 1400 - 1600 | 12 |
Find the mean number of words written.
The numbers 6, 8, 10, 12, 13 and x are arranged in an ascending order. If the mean of the observations is equal to the median, find the value of x
A survey regarding the height (in cm) of 51 girls of class X of a school was conducted and the following data was obtained:
| Height in cm | Number of Girls |
| Less than 140 | 4 |
| Less than 145 | 11 |
| Less than 150 | 29 |
| Less than 155 | 40 |
| Less than 160 | 46 |
| Less than 165 | 51 |
Find the median height.
From the following data, find:
Median
25, 10, 40, 88, 45, 60, 77, 36, 18, 95, 56, 65, 7, 0, 38 and 83
Find the median from the following data:
| Class | 1 – 5 | 6 – 10 | 11 – 15 | 16 – 20 | 21 – 25 | 26 – 30 | 31 – 35 | 35 – 40 | 40 – 45 |
| Frequency | 7 | 10 | 16 | 32 | 24 | 16 | 11 | 5 | 2 |
The following frequency distribution table gives the ages of 200 patients treated in a hospital in a week. Find the mode of ages of the patients.
| Age (years) | Less than 5 | 5 - 9 | 10 - 14 | 15 - 19 | 20 - 24 | 25 - 29 |
| No. of patients | 38 | 32 | 50 | 36 | 24 | 20 |
The annual rainfall record of a city for 66 days is given in the following table :
| Rainfall (in cm ): | 0-10 | 10-20 | 20-30 | 30-40 | 40-50 | 50-60 |
| Number of days : | 22 | 10 | 8 | 15 | 5 | 6 |
Calculate the median rainfall using ogives of more than type and less than type.
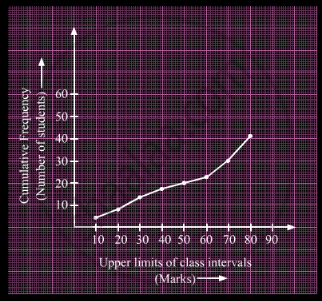
A student draws a cumulative frequency curve for the marks obtained by 40 students of a class as shown below. Find the median marks obtained by the students of the class.

If 35 is removed from the data: 30, 34, 35, 36, 37, 38, 39, 40, then the median increased by
For the following distribution
| Marks | 0 - 10 | 10 - 20 | 20 - 30 | 30 - 40 | 40 - 50 |
| No. of Students | 3 | 9 | 13 | 10 | 5 |
the number of students who got marks less than 30 is?
