Advertisements
Advertisements
Question
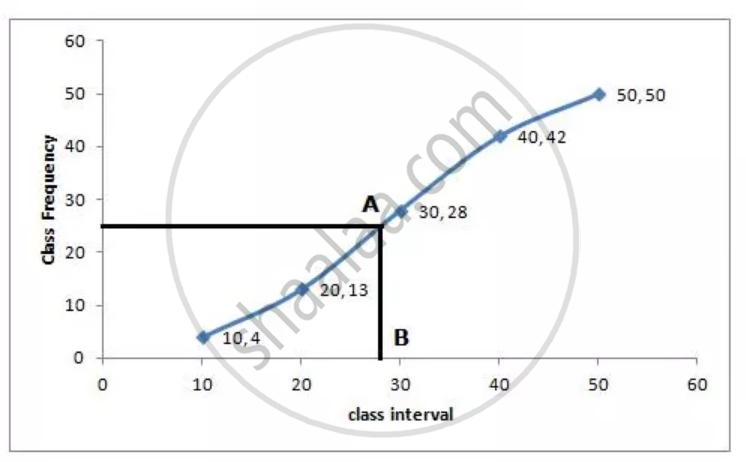
Estimate the median for the given data by drawing an ogive:
| Class | 0 – 10 | 10 – 20 | 20 – 30 | 30 – 40 | 40 – 50 |
| Frequency | 4 | 9 | 15 | 14 | 8 |
Solution
| Class | Frequency | Cumulative Frequency |
| 0 – 10 | 4 | 4 |
| 10 – 20 | 9 | 13 |
| 20 – 30 | 15 | 28 |
| 30 – 40 | 14 | 42 |
| 40 – 50 | 8 | 50 |
Number of terms = 50
∴ Median = `(25 + 26^(th))/2` term
= 25.5th term

Through mark of 25.5 on the y-axis, draw a line parallel to x-axis which meets the curve at A. From A, draw a perpendicular to x-axis, which meets x-axis at B.
The value of B is the median which is 28
APPEARS IN
RELATED QUESTIONS
The following is the distribution of the size of certain farms from a taluka (tehasil):
| Size of Farms (in acres) |
Number of Farms |
| 5 – 15 | 7 |
| 15 – 25 | 12 |
| 25 – 35 | 17 |
| 35 – 45 | 25 |
| 45 – 55 | 31 |
| 55 – 65 | 5 |
| 65 – 75 | 3 |
Find median size of farms.
A survey regarding the height (in cm) of 51 girls of class X of a school was conducted and the following data was obtained:
| Height in cm | Number of Girls |
| Less than 140 | 4 |
| Less than 145 | 11 |
| Less than 150 | 29 |
| Less than 155 | 40 |
| Less than 160 | 46 |
| Less than 165 | 51 |
Find the median height.
Calculate the median from the following data:
| Height(in cm) | 135 - 140 | 140 - 145 | 145 - 150 | 150 - 155 | 155 - 160 | 160 - 165 | 165 - 170 | 170 - 175 |
| Frequency | 6 | 10 | 18 | 22 | 20 | 15 | 6 | 3 |
Find the median wages for the following frequency distribution:
| Wages per day (in Rs) | 61 – 70 | 71 – 80 | 81 – 90 | 91 – 100 | 101 – 110 | 111 – 120 |
| No. of women workers | 5 | 15 | 20 | 30 | 20 | 8 |
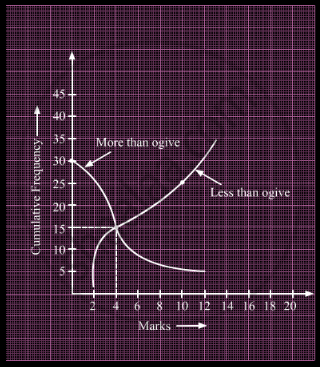
What is the value of the median of the data using the graph in the following figure of less than ogive and more than ogive?

Find the median of:
66, 98, 54, 92, 87, 63, 72.
The median of the following observations 11, 12, 14, (x – 2), (x + 4), (x + 9), 32, 38, 47 arranged in ascending order is 24. Find the value of x and hence find the mean.
For the following distribution
| Marks | 0 - 10 | 10 - 20 | 20 - 30 | 30 - 40 | 40 - 50 |
| No. of Students | 3 | 9 | 13 | 10 | 5 |
the number of students who got marks less than 30 is?
Calculate the median of marks of students for the following distribution:
| Marks | Number of students |
| More than or equal to 0 | 100 |
| More than or equal to 10 | 93 |
| More than or equal to 20 | 88 |
| More than or equal to 30 | 70 |
| More than or equal to 40 | 59 |
| More than or equal to 50 | 42 |
| More than or equal to 60 | 34 |
| More than or equal to 70 | 20 |
| More than or equal to 80 | 11 |
| More than or equal to 90 | 4 |
The monthly expenditure on milk in 200 families of a Housing Society is given below:
| Monthly Expenditure (in ₹) |
1000 – 1500 | 1500 – 2000 | 2000 – 2500 | 2500 – 3000 | 3000 – 3500 | 3500 – 4000 | 4000 – 4500 | 4500 – 5000 |
| Number of families | 24 | 40 | 33 | x | 30 | 22 | 16 | 7 |
Find the value of x and also, find the median and mean expenditure on milk.
