Advertisements
Advertisements
प्रश्न
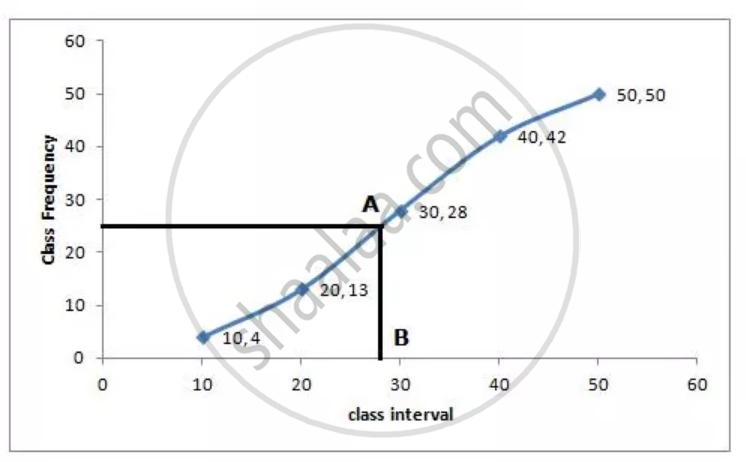
Estimate the median for the given data by drawing an ogive:
| Class | 0 – 10 | 10 – 20 | 20 – 30 | 30 – 40 | 40 – 50 |
| Frequency | 4 | 9 | 15 | 14 | 8 |
उत्तर
| Class | Frequency | Cumulative Frequency |
| 0 – 10 | 4 | 4 |
| 10 – 20 | 9 | 13 |
| 20 – 30 | 15 | 28 |
| 30 – 40 | 14 | 42 |
| 40 – 50 | 8 | 50 |
Number of terms = 50
∴ Median = `(25 + 26^(th))/2` term
= 25.5th term

Through mark of 25.5 on the y-axis, draw a line parallel to x-axis which meets the curve at A. From A, draw a perpendicular to x-axis, which meets x-axis at B.
The value of B is the median which is 28
APPEARS IN
संबंधित प्रश्न
100 surnames were randomly picked up from a local telephone directory and the frequency distribution of the number of letters in the English alphabets in the surnames was obtained as follows:
| Number of letters | Number of surnames |
| 1 - 4 | 6 |
| 4 − 7 | 30 |
| 7 - 10 | 40 |
| 10 - 13 | 6 |
| 13 - 16 | 4 |
| 16 − 19 | 4 |
Determine the median number of letters in the surnames. Find the mean number of letters in the surnames? Also, find the modal size of the surnames.
Find the following table gives the distribution of the life time of 400 neon lamps:
| Life time (in hours) | Number of lamps |
| 1500 – 2000 | 14 |
| 2000 – 2500 | 56 |
| 2500 – 3000 | 60 |
| 3000 – 3500 | 86 |
| 3500 – 4000 | 74 |
| 4000 – 4500 | 62 |
| 4500 – 5000 | 48 |
Find the median life time of a lamp.
From the following data, find:
Inter-quartile range
25, 10, 40, 88, 45, 60, 77, 36, 18, 95, 56, 65, 7, 0, 38 and 83
The ages of 37 students in a class are given in the following table:
| Age (in years) | 11 | 12 | 13 | 14 | 15 | 16 |
| Frequency | 2 | 4 | 6 | 10 | 8 | 7 |
The following table shows the daily wages of workers in a factory:
| Daily wages in (Rs) | 0 – 100 | 100 – 200 | 200 – 300 | 300 – 400 | 400 – 500 |
| Number of workers | 40 | 32 | 48 | 22 | 8 |
Find the median daily wage income of the workers.
Obtain the median for the following frequency distribution:
| x : | 1 | 2 | 3 | 4 | 5 | 6 | 7 | 8 | 9 |
| f : | 8 | 10 | 11 | 16 | 20 | 25 | 15 | 9 | 6 |
The abscissa of the point of intersection of the less than type and of the more than type cumulative frequency curves of a grouped data gives its ______.
Heights of 50 students of class X of a school are recorded and following data is obtained:
| Height (in cm) | 130 – 135 | 135 – 140 | 140 – 145 | 145 – 150 | 150 – 155 | 155 – 160 |
| Number of students | 4 | 11 | 12 | 7 | 10 | 6 |
Find the median height of the students.
The monthly expenditure on milk in 200 families of a Housing Society is given below:
| Monthly Expenditure (in ₹) |
1000 – 1500 | 1500 – 2000 | 2000 – 2500 | 2500 – 3000 | 3000 – 3500 | 3500 – 4000 | 4000 – 4500 | 4500 – 5000 |
| Number of families | 24 | 40 | 33 | x | 30 | 22 | 16 | 7 |
Find the value of x and also, find the median and mean expenditure on milk.
The following table shows classification of number of workers and number of hours they work in software company. Prepare less than upper limit type cumulative frequency distribution table:
| Number of hours daily | Number of workers |
| 8 - 10 | 150 |
| 10 - 12 | 500 |
| 12 - 14 | 300 |
| 14 - 16 | 50 |
