Advertisements
Online Mock Tests
Chapters
2: Banking (Recurring Deposit Account)
3: Shares and Dividend
4: Linear Inequations (In one variable)
5: Quadratic Equations
6: Solving (simple) Problems (Based on Quadratic Equations)
7: Ratio and Proportion (Including Properties and Uses)
8: Remainder and Factor Theorems
9: Matrices
10: Arithmetic Progression
11: Geometric Progression
12: Reflection
13: Section and Mid-Point Formula
14: Equation of a Line
15: Similarity (With Applications to Maps and Models)
16: Loci (Locus and Its Constructions)
17: Circles
18: Tangents and Intersecting Chords
19: Constructions (Circles)
20: Cylinder, Cone and Sphere
21: Trigonometrical Identities
22: Height and Distances
23: Graphical Representation
▶ 24: Measure of Central Tendency(Mean, Median, Quartiles and Mode)
25: Probability
![Selina solutions for Mathematics [English] Class 10 ICSE chapter 24 - Measure of Central Tendency(Mean, Median, Quartiles and Mode) - Shaalaa.com](/images/mathematics-english-class-10-icse_6:8bf8c01058454f579d37da35940563b5.png "Selina solutions for Mathematics [English] Class 10 ICSE chapter 24 - Measure of Central Tendency(Mean, Median, Quartiles and Mode)")
Advertisements
Solutions for Chapter 24: Measure of Central Tendency(Mean, Median, Quartiles and Mode)
Below listed, you can find solutions for Chapter 24 of CISCE Selina for Mathematics [English] Class 10 ICSE.
Selina solutions for Mathematics [English] Class 10 ICSE 24 Measure of Central Tendency(Mean, Median, Quartiles and Mode) Exercise 24 (A) [Page 356]
Find the mean of the following set of numbers:
6, 9, 11, 12 and 7
Find the mean of the following set of numbers:
11, 14, 23, 26, 10, 12, 18 and 6
Marks obtained (in mathematics) by 9 students are given below:
60, 67, 52, 76, 50, 51, 74, 45 and 56
- Find the arithmetic mean.
- If marks of each student be increased by 4; what will be the new value of arithmetic mean?
Marks obtained (in mathematics) by 9 student are given below:
60, 67, 52, 76, 50, 51, 74, 45 and 56
if marks of each student be increased by 4; what will be the new value of arithmetic mean.
Find the mean of the natural numbers from 3 to 12.
- Find the mean of 7, 11, 6, 5 and 6.
- If each number given in (a) is diminished by 2; find the new value of mean.
If each number given in (a) is diminished by 2, find the new value of mean.
If the mean of 6, 4, 7, ‘a’ and 10 is 8. Find the value of ‘a’
The mean of the number 6, ‘y’, 7, ‘x’ and 14 is 8. Express ‘y’ in terms of ‘x’.
The ages of 40 students are given in the following table :
| Age (in years) | 12 | 13 | 14 | 15 | 16 | 17 | 18 |
| Frequency | 2 | 4 | 6 | 9 | 8 | 7 | 4 |
Find the arithmetic mean.
If 69.5 is the mean of 72, 70, ‘x’, 62, 50, 71, 90, 64, 58 and 82, find the value of ‘x’.
The following table gives the heights of plants in centimeter. If the mean height of plants is 60.95 cm; find the value of 'f'.
| Height (cm) | 50 | 55 | 58 | 60 | 65 | 70 | 71 |
| No. of plants | 2 | 4 | 10 | f | 5 | 4 | 3 |
From the data given below, calculate the mean wage, correct to the nearest rupee.
| Category | A | B | C | D | E | F |
| Wages (Rs/day) | 50 | 60 | 70 | 80 | 90 | 100 |
| No. of workers | 2 | 4 | 8 | 12 | 10 | 6 |
- If the number of workers in each category is doubled, what would be the new mean wage?
- If the wages per day in each category are increased by 60%; what is the new mean wage?
- If the number of workers in each category is doubled and the wages per day per worker are reduced by 40%, what would be the new mean wage?
The contents of 100 match boxes were checked to determine the number of matches they contained.
| No. of matches | 35 | 36 | 37 | 38 | 39 | 40 | 41 |
| No. of boxes | 6 | 10 | 18 | 25 | 21 | 12 | 8 |
- Calculate, correct to one decimal place, the mean number of matches per box.
- Determine, how many extra matches would have to be added to the total contents of the 100 boxes to bring the mean up to exactly 39 matches.
If the mean of the following distribution is 3, find the value of p.
| x | 1 | 2 | 3 | 5 | p + 4 |
| f | 9 | 6 | 9 | 3 | 6 |
In the following table, Σf = 200 and mean = 73. Find the missing frequencies f1, and f2.
| x | 0 | 50 | 100 | 150 | 200 | 250 |
| f | 46 | f1 | f2 | 25 | 10 | 5 |
Find the arithmetic mean (correct to the nearest whole number) by using step-deviation method.
| x | 5 | 10 | 15 | 20 | 25 | 30 | 35 | 40 | 45 | 50 |
| f | 20 | 43 | 75 | 67 | 72 | 45 | 39 | 9 | 8 | 6 |
Find the mean (correct to one place of decimal) by using short-cut method.
|
x |
40 |
41 |
43 |
45 |
46 |
49 |
50 |
|
f |
14 |
28 |
38 |
50 |
40 |
20 |
10 |
Selina solutions for Mathematics [English] Class 10 ICSE 24 Measure of Central Tendency(Mean, Median, Quartiles and Mode) Exercise 24 (B) [Pages 362 - 363]
The following table gives the age of 50 student of a class. Find the arithmetic mean of their ages.
| Age-years | 16 – 18 | 18 – 20 | 20 – 22 | 22 – 24 | 24 – 26 |
| No. of students | 2 | 7 | 21 | 17 | 3 |
The following table gives the weekly wages of workers in a factory.
| Weekly wages (Rs) | No. of workers |
| 50 – 55 | 5 |
| 55 – 60 | 20 |
| 60 – 65 | 10 |
| 65 – 70 | 10 |
| 70 – 75 | 9 |
| 75 – 80 | 6 |
| 80 – 85 | 12 |
| 85 – 90 | 8 |
Calculate the mean by using:
Direct Method
The following table gives the weekly wages of workers in a factory.
| Weekly wages (Rs) | No. of workers |
| 50 – 55 | 5 |
| 55 – 60 | 20 |
| 60 – 65 | 10 |
| 65 – 70 | 10 |
| 70 – 75 | 9 |
| 75 – 80 | 6 |
| 80 – 85 | 12 |
| 85 – 90 | 8 |
Calculate the mean by using:
Short-cut method
The following are the marks obtained by 70 boys in a class test:
| Marks | No. of boys |
| 30 – 40 | 10 |
| 40 – 50 | 12 |
| 50 – 60 | 14 |
| 60 – 70 | 12 |
| 70 – 80 | 9 |
| 80 – 90 | 7 |
| 90 – 100 | 6 |
Calculate the mean by:
Short-cut method
The following are the marks obtained by 70 boys in a class test:
| Marks | No. of boys |
| 30 – 40 | 10 |
| 40 – 50 | 12 |
| 50 – 60 | 14 |
| 60 – 70 | 12 |
| 70 – 80 | 9 |
| 80 – 90 | 7 |
| 90 – 100 | 6 |
Calculate the mean by:
Step-deviation method
Find mean by step-deviation method:
| C.I. | 63 – 70 | 70 – 77 | 77 – 84 | 84 – 91 | 91 – 98 | 98 – 105 | 105 – 112 |
| Frequency | 9 | 13 | 27 | 38 | 32 | 16 | 15 |
The mean of the following distribution is `21 1/7`. Find the value of ‘f’.
| C.I. | 0 – 10 | 10 – 20 | 20 – 30 | 30 – 40 | 40 – 50 |
| Frequency | 8 | 22 | 31 | f | 2 |
Using step-deviation method, calculate the mean marks of the following distribution.
| C.I. | 50 – 55 | 55 – 60 | 60 – 65 | 65 – 70 | 70 – 75 | 75 – 80 | 80 – 85 | 85 – 90 |
| Frequency | 5 | 20 | 10 | 10 | 9 | 6 | 12 | 8 |
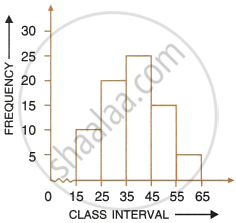
Using the information given in the adjoining histogram, calculate the mean.
If the mean of the following observations is 54, find the value of p.
| Class | 0 – 20 | 20 – 40 | 40 – 60 | 60 – 80 | 80 – 100 |
| Frequency | 7 | p | 10 | 9 | 13 |
The mean of the following distribution is 62.8 and the sum of all the frequencies is 50. Find the missing frequencies f1 and f2.
| Class | 0 – 20 | 20 – 40 | 40 – 60 | 60 – 80 | 80 – 100 | 100 – 120 |
| Frequency | 5 | f1 | 10 | f2 | 7 | 8 |
Calculate the mean of the distribution, given below using the short cut method:
| Marks | 11 – 20 | 21 – 30 | 31 – 40 | 41 – 50 | 51 – 60 | 61 – 70 | 71 – 80 |
| No. of students | 2 | 6 | 10 | 12 | 9 | 7 | 4 |
Selina solutions for Mathematics [English] Class 10 ICSE 24 Measure of Central Tendency(Mean, Median, Quartiles and Mode) Exercise 24 (C) [Pages 372 - 373]
A student got the following marks in 9 questions of a question paper.
3, 5, 7, 3, 8, 0, 1, 4 and 6.
Find the median of these marks.
The weights (in kg) of 10 students of a class are given below:
21, 28.5, 20.5, 24, 25.5, 22, 27.5, 28, 21 and 24.
Find the median of their weights.
The marks obtained by 19 students of a class are given below:
27, 36, 22, 31, 25, 26, 33, 24, 37, 32, 29, 28, 36, 35, 27, 26, 32, 35 and 28.
Find:
- Median
- Lower quartile
- Upper quartile
- Inter-quartile range
From the following data, find:
Median
25, 10, 40, 88, 45, 60, 77, 36, 18, 95, 56, 65, 7, 0, 38 and 83
From the following data, find:
Upper quartile
25, 10, 40, 88, 45, 60, 77, 36, 18, 95, 56, 65, 7, 0, 38 and 83
From the following data, find:
Inter-quartile range
25, 10, 40, 88, 45, 60, 77, 36, 18, 95, 56, 65, 7, 0, 38 and 83
The ages of 37 students in a class are given in the following table:
| Age (in years) | 11 | 12 | 13 | 14 | 15 | 16 |
| Frequency | 2 | 4 | 6 | 10 | 8 | 7 |
The weight of 60 boys are given in the following distribution table:
| Weight (kg) | 37 | 38 | 39 | 40 | 41 |
| No. of boys | 10 | 14 | 18 | 12 | 6 |
Find:
- Median
- Lower quartile
- Upper quartile
- Inter-quartile range
Estimate the median for the given data by drawing an ogive:
| Class | 0 – 10 | 10 – 20 | 20 – 30 | 30 – 40 | 40 – 50 |
| Frequency | 4 | 9 | 15 | 14 | 8 |
By drawing an ogive, estimate the median for the following frequency distribution:
| Weight (kg) | 10 – 15 | 15 – 20 | 20 – 25 | 25 – 30 | 30 – 35 |
| No. of boys | 11 | 25 | 12 | 5 | 2 |
From the following cumulative frequency table, draw ogive and then use it to find:
- Median
- Lower quartile
- Upper quartile
| Marks (less than) | 10 | 20 | 30 | 40 | 50 | 60 | 70 | 80 | 90 | 100 |
| Cumulative frequency | 5 | 24 | 37 | 40 | 42 | 48 | 70 | 77 | 79 | 80 |
In a school, 100 pupils have heights as tabulate below:
| Height (in cm) | No. of pupils |
| 121 – 130 | 12 |
| 131 – 140 | 16 |
| 141 – 150 | 30 |
| 151 – 160 | 20 |
| 161 – 170 | 14 |
| 171 – 180 | 8 |
Find the median height by drawing an ogive.
Selina solutions for Mathematics [English] Class 10 ICSE 24 Measure of Central Tendency(Mean, Median, Quartiles and Mode) Exercise 24 (D) [Page 374]
Find the mode of the following data:
7, 9, 8, 7, 7, 6, 8, 10, 7 and 6
Find the mode of the following data:
9, 11, 8, 11, 16, 9, 11, 5, 3, 11, 17 and 8
The following table shows the frequency distribution of heights of 51 boys:
| Height (cm) | 120 | 121 | 122 | 123 | 124 |
| Frequency | 5 | 8 | 18 | 10 | 9 |
Find the mode of heights.
Find the mode of following data, using a histogram:
| Class | 0 – 10 | 10 – 20 | 20 – 30 | 30 – 40 | 40 – 50 |
| Frequency | 5 | 12 | 20 | 9 | 4 |
The following table shows the expenditure of 60 boys on books. Find the mode of their expenditure:
| Expenditure (Rs) | No. of students |
| 20 – 25 | 4 |
| 25 – 30 | 7 |
| 30 – 35 | 23 |
| 35 – 40 | 18 |
| 40 – 45 | 6 |
| 45 – 50 | 2 |
Find the median and mode for the set of numbers:
2, 2, 3, 5, 5, 5, 6, 8 and 9
A boy scored following marks in various class tests during a term; each test being marked out of 20.
15, 17, 16, 7, 10, 12, 14, 16, 19, 12 and 16
What are his modal marks?
A boy scored following marks in various class tests during a term; each test being marked out of 20.
15, 17, 16, 7, 10, 12, 14, 16, 19, 12 and 16
What are his median marks?
A boy scored following marks in various class tests during a term; each test being marked out of 20.
15, 17, 16, 7, 10, 12, 14, 16, 19, 12 and 16
What are his total marks?
A boy scored following marks in various class tests during a term; each test being marked out of 20.
15, 17, 16, 7, 10, 12, 14, 16, 19, 12 and 16
What are his mean marks?
Find the mean, median and mode of the following marks obtained by 16 students in a class test marked out of 10 marks:
0, 0, 2, 2, 3, 3, 3, 4, 5, 5, 5, 5, 6, 6, 7 and 8.
At a shooting competition the score of a competitor were as given below:
| Score | 0 | 1 | 2 | 3 | 4 | 5 |
| No. of shots | 0 | 3 | 6 | 4 | 7 | 5 |
- What was his modal score?
- What was his median score?
- What was his total score?
- What was his mean score?
Selina solutions for Mathematics [English] Class 10 ICSE 24 Measure of Central Tendency(Mean, Median, Quartiles and Mode) Exercise 24 (E) [Pages 375 - 377]
The following distribution represents the height of 160 students of a school.
| Height (in cm) | No. of Students |
| 140 – 145 | 12 |
| 145 – 150 | 20 |
| 150 – 155 | 30 |
| 155 – 160 | 38 |
| 160 – 165 | 24 |
| 165 – 170 | 16 |
| 170 – 175 | 12 |
| 175 – 180 | 8 |
Draw an ogive for the given distribution taking 2 cm = 5 cm of height on one axis and 2 cm = 20 students on the other axis. Using the graph, determine:
- The median height.
- The interquartile range.
- The number of students whose height is above 172 cm.
The mean of 1, 7, 5, 3, 4 and 4 is m. The numbers 3, 2, 4, 2, 3, 3 and p have mean m – 1 and median q. Find p and q.
In a malaria epidemic, the number of cases diagnosed were as follows:
| Date July | 1 | 2 | 3 | 4 | 5 | 6 | 7 | 8 | 9 | 10 | 11 | 12 |
| Num | 5 | 12 | 20 | 27 | 46 | 30 | 31 | 18 | 11 | 5 | 0 | 1 |
On what days do the mode and upper and lower quartiles occur?
Income of 100 students of their parents is given as follows:
| Income (in thousand Rs.) |
No. of students (f) |
| 0 – 8 | 8 |
| 8 – 16 | 35 |
| 16 – 24 | 35 |
| 24 – 32 | 14 |
| 32 – 40 | 8 |
Draw an ogive for the given distribution on a graph sheet. Use a suitable scale for your exercise. Use your ogive to estimate:
- the median income.
- Calculate the income below which freeship will be awarded to students if their parents income is in the bottom 15%
- Mean income.
The marks of 20 students in a test were as follows:
2, 6, 8, 9, 10, 11, 11, 12, 13, 13, 14, 14, 15, 15, 15, 16, 16, 18, 19 and 20.
Calculate:
- the mean
- the median
- the mode
The marks obtained by 120 students in a mathematics test is given below:
| Marks | No. of students |
| 0 – 10 | 5 |
| 10 – 20 | 9 |
| 20 – 30 | 16 |
| 30 – 40 | 22 |
| 40 – 50 | 26 |
| 50 – 60 | 18 |
| 60 – 70 | 11 |
| 70 – 80 | 6 |
| 80 – 90 | 4 |
| 90 – 100 | 3 |
Draw an ogive for the given distributions on a graph sheet. Use a suitable scale for your ogive. Use your ogive to estimate:
- the median
- the number of student who obtained more than 75% in test.
- the number of students who did not pass in the test if the pass percentage was 40.
- the lower quartile.
Using a graph paper, draw an ogive for the following distribution which shows a record of the width in kilograms of 200 students.
| Weight | Frequency |
| 40 – 45 | 5 |
| 45 – 50 | 17 |
| 50 – 55 | 22 |
| 55 – 60 | 45 |
| 60 – 65 | 51 |
| 65 – 70 | 31 |
| 70 – 75 | 20 |
| 75 – 80 | 9 |
Use your ogive to estimate the following:
- The percentage of student weighting 55 kg or more
- The weight above which the heaviest 30% of the student fall
- The number of students who are
- underweight
- overweight, If 55.70 kg is considered as standard weight.
The distribution, given below, shows the marks obtained by 25 students in an aptitude test. Find the mean, median and mode of the distribution.
| Marks obtained | 5 | 6 | 7 | 8 | 9 | 10 |
| No. of students | 3 | 9 | 6 | 4 | 2 | 1 |
The mean of the following distribution in 52 and the frequency of class interval 30-40 'f' find f
| C.I | 10-20 | 20-30 | 30-40 | 40-50 | 50-60 | 60-70 | 70-80 |
| freq | 5 | 3 | f | 7 | 2 | 6 | 13 |
The monthly income of a group of 320 employees in a company is given below:
| Monthly income (thousands) | No. of employees |
| 6-7 | 20 |
| 7-8 | 45 |
| 8-9 | 65 |
| 9-10 | 95 |
| 10-11 | 60 |
| 11-12 | 30 |
| 12-13 | 5 |
Draw an ogive of the distribution on a graph paper taking 2 cm = Rs. 1000 on one axis and 2 cm = 50 employees on the other axis. From the graph detemine:
- the median wage.
- number of employee whose income is below Rs. 8,500.
- If salary of a senior employee is above Rs. 11,500, find the number of senior employee in the company.
- the upper quartile.
A mathematics aptitude test of 50 students was recored as follows:
| Marks | No. of students |
| 50-60 | 4 |
| 60-70 | 8 |
| 70-80 | 14 |
| 80-90 | 19 |
| 90-100 | 5 |
Draw a histrogram for the above data using a graph paper and locate the mode.
Marks obtained by 200 students in an examination are given below:
| Marks | No. of students |
| 0 – 10 | 5 |
| 10 – 20 | 11 |
| 20 – 30 | 10 |
| 30 – 40 | 20 |
| 40 – 50 | 28 |
| 50 – 60 | 37 |
| 60 – 70 | 40 |
| 70 – 80 | 29 |
| 80 – 90 | 14 |
| 90 – 100 | 6 |
Draw an ogive for the given distribution taking 2 cm = 10 marks on one axis and 2 cm = 20 students on the other axis. Using the graph, determine:
- The median marks.
- The number of students who failed if minimum marks required to pass is 40.
- If scoring 85 and more marks are considered as grade one, find the number of students who secured grade one in the examination.
Marks obtained by 40 students in a short assessment is given below, where a and b are two missing data.
| Marks | 5 | 6 | 7 | 8 | 9 |
| Number of Students | 6 | a | 16 | 13 | b |
If the mean of the distribution is 7.2, find a and b.
Find the mode and the median of the following frequency distributions.
| x | 10 | 11 | 12 | 13 | 14 | 15 |
| f | 1 | 4 | 7 | 5 | 9 | 3 |
The mean of following numbers is 68. Find the value of ‘x’. 45, 52, 60, x, 69, 70, 26, 81 and 94. Hence, estimate the median.
The marks of 10 students of a class in an examination arranged in ascending order is as follows:
13, 35, 43, 46, x, x + 4, 55, 61, 71, 80
If the median marks is 48, find the value of x. Hence, find the mode of the given data.
The daily wages of 80 workers in a project are given below.
| Wages (in Rs.) |
400-450 | 450-500 | 500-550 | 550-600 | 600-650 | 650-700 | 700-750 |
| No. of workers |
2 | 6 | 12 | 18 | 24 | 13 | 5 |
Use a graph paper to draw an ogive for the above distribution. (Use a scale of 2 cm = Rs. 50 on x-axis and 2 cm = 10 workers on y-axis). Use your ogive to estimate:
- the median wage of the workers.
- the lower quartile wage of workers.
- the numbers of workers who earn more than Rs. 625 daily.
The histogram below represents the scores obtained by 25 students in a mathematics mental test. Use the data to:
- Frame a frequency distribution table.
- To calculate mean.
- To determine the Modal class.

Solutions for 24: Measure of Central Tendency(Mean, Median, Quartiles and Mode)
Selina solutions for Mathematics [English] Class 10 ICSE chapter 24 - Measure of Central Tendency(Mean, Median, Quartiles and Mode)
Shaalaa.com has the CISCE Mathematics Mathematics [English] Class 10 ICSE CISCE solutions in a manner that help students grasp basic concepts better and faster. The detailed, step-by-step solutions will help you understand the concepts better and clarify any confusion. Selina solutions for Mathematics Mathematics [English] Class 10 ICSE CISCE 24 (Measure of Central Tendency(Mean, Median, Quartiles and Mode)) include all questions with answers and detailed explanations. This will clear students' doubts about questions and improve their application skills while preparing for board exams.
Further, we at Shaalaa.com provide such solutions so students can prepare for written exams. Selina textbook solutions can be a core help for self-study and provide excellent self-help guidance for students.
Concepts covered in Mathematics [English] Class 10 ICSE chapter 24 Measure of Central Tendency(Mean, Median, Quartiles and Mode) are Median of Grouped Data, Ogives (Cumulative Frequency Graphs), Concepts of Statistics, Graphical Representation of Ogives, Finding the Mode from the Histogram, Finding the Mode from the Upper Quartile, Finding the Mode from the Lower Quartile, Finding the Median, upper quartile, lower quartile from the Ogive, Calculation of Lower, Upper, Inter, Semi-Inter Quartile Range, Concept of Median, Graphical Representation of Data as Histograms, Mean of Grouped Data, Mean of Ungrouped Data, Median of Ungrouped Data, Mode of Ungrouped Data, Mode of Grouped Data, Mean of Continuous Distribution, Graphical Representation of Data as Histograms, Median of Grouped Data, Ogives (Cumulative Frequency Graphs), Concepts of Statistics, Graphical Representation of Ogives, Finding the Mode from the Histogram, Finding the Mode from the Upper Quartile, Finding the Mode from the Lower Quartile, Finding the Median, upper quartile, lower quartile from the Ogive, Calculation of Lower, Upper, Inter, Semi-Inter Quartile Range, Concept of Median, Graphical Representation of Data as Histograms, Mean of Grouped Data, Mean of Ungrouped Data, Median of Ungrouped Data, Mode of Ungrouped Data, Mode of Grouped Data, Mean of Continuous Distribution, Graphical Representation of Data as Histograms.
Using Selina Mathematics [English] Class 10 ICSE solutions Measure of Central Tendency(Mean, Median, Quartiles and Mode) exercise by students is an easy way to prepare for the exams, as they involve solutions arranged chapter-wise and also page-wise. The questions involved in Selina Solutions are essential questions that can be asked in the final exam. Maximum CISCE Mathematics [English] Class 10 ICSE students prefer Selina Textbook Solutions to score more in exams.
Get the free view of Chapter 24, Measure of Central Tendency(Mean, Median, Quartiles and Mode) Mathematics [English] Class 10 ICSE additional questions for Mathematics Mathematics [English] Class 10 ICSE CISCE, and you can use Shaalaa.com to keep it handy for your exam preparation.
