Advertisements
Advertisements
Question
The following distribution represents the height of 160 students of a school.
| Height (in cm) | No. of Students |
| 140 – 145 | 12 |
| 145 – 150 | 20 |
| 150 – 155 | 30 |
| 155 – 160 | 38 |
| 160 – 165 | 24 |
| 165 – 170 | 16 |
| 170 – 175 | 12 |
| 175 – 180 | 8 |
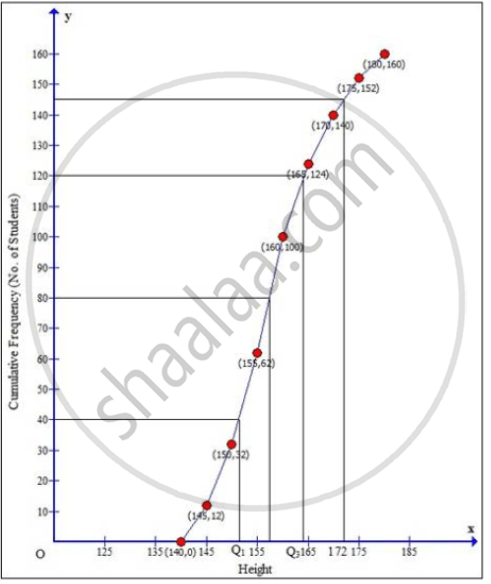
Draw an ogive for the given distribution taking 2 cm = 5 cm of height on one axis and 2 cm = 20 students on the other axis. Using the graph, determine:
- The median height.
- The interquartile range.
- The number of students whose height is above 172 cm.
Solution
| Height (in cm) |
No. of students |
Cumulative frequency |
| 140 – 145 | 12 | 12 |
| 145 – 150 | 20 | 32 |
| 150 – 155 | 30 | 62 |
| 155 – 160 | 38 | 100 |
| 160 – 165 | 24 | 124 |
| 165 – 170 | 16 | 140 |
| 170 – 175 | 12 | 152 |
| 175 – 180 | 8 | 160 |
| N = 160 |
Taking height of student along x-axis and cumulative frequency along y-axis we will draw an ogive.

i. ∴ Median = `160/2` = 80th term
Through mark for 80, draw a parallel line to x-axis which meets the curve; then from the curve draw a vertical line which meets the x-axis at the mark of 157.5.
ii. Since, number of terms = 160
Lower quartile (Q1) = `(160/4)` = 40th term = 152
Upper quartile (Q3) = `((3 xx 160)/4)` = 120th term = 164
Inner Quartile range = Q3 – Q1
= 164 – 152
= 12
iii. Through mark for 172 on x-axis, draw a vertical line which meets the curve; then from the curve draw a horizontal line which meets the y-axis at the mark of 145.
The number of students whose height is above 172 cm = 160 – 144 = 16
APPEARS IN
RELATED QUESTIONS
If the mean of 6, 4, 7, ‘a’ and 10 is 8. Find the value of ‘a’
The following table gives the weekly wages of workers in a factory.
| Weekly wages (Rs) | No. of workers |
| 50 – 55 | 5 |
| 55 – 60 | 20 |
| 60 – 65 | 10 |
| 65 – 70 | 10 |
| 70 – 75 | 9 |
| 75 – 80 | 6 |
| 80 – 85 | 12 |
| 85 – 90 | 8 |
Calculate the mean by using:
Direct Method
The following table shows the frequency distribution of heights of 51 boys:
| Height (cm) | 120 | 121 | 122 | 123 | 124 |
| Frequency | 5 | 8 | 18 | 10 | 9 |
Find the mode of heights.
The following table shows the expenditure of 60 boys on books. Find the mode of their expenditure:
| Expenditure (Rs) | No. of students |
| 20 – 25 | 4 |
| 25 – 30 | 7 |
| 30 – 35 | 23 |
| 35 – 40 | 18 |
| 40 – 45 | 6 |
| 45 – 50 | 2 |
Find the mode of the following:
6, 7, 1, 8,6,5, 9, 4, 6, 7, 1,3, 2, 6, 7,8
Draw a histogram for the following distribution and estimate the mode:
| I.Q. Score | 80-100 | 100-120 | 120-140 | 140-160 | 160-180 | 180-200 |
| No. of Students | 6 | 9 | 16 | 13 | 4 | 2 |
Find the mean of all factors of 10.
Find the mean of: first six even natural numbers
Find the median of the given data: 36, 44, 86, 31, 37, 44, 86, 35, 60, 51
The median of any data lies between the ______ and ______ observations.
