Advertisements
Advertisements
प्रश्न
The following distribution represents the height of 160 students of a school.
| Height (in cm) | No. of Students |
| 140 – 145 | 12 |
| 145 – 150 | 20 |
| 150 – 155 | 30 |
| 155 – 160 | 38 |
| 160 – 165 | 24 |
| 165 – 170 | 16 |
| 170 – 175 | 12 |
| 175 – 180 | 8 |
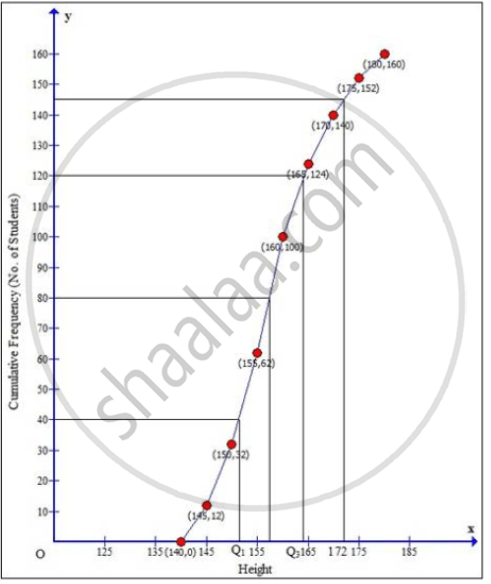
Draw an ogive for the given distribution taking 2 cm = 5 cm of height on one axis and 2 cm = 20 students on the other axis. Using the graph, determine:
- The median height.
- The interquartile range.
- The number of students whose height is above 172 cm.
उत्तर
| Height (in cm) |
No. of students |
Cumulative frequency |
| 140 – 145 | 12 | 12 |
| 145 – 150 | 20 | 32 |
| 150 – 155 | 30 | 62 |
| 155 – 160 | 38 | 100 |
| 160 – 165 | 24 | 124 |
| 165 – 170 | 16 | 140 |
| 170 – 175 | 12 | 152 |
| 175 – 180 | 8 | 160 |
| N = 160 |
Taking height of student along x-axis and cumulative frequency along y-axis we will draw an ogive.

i. ∴ Median = `160/2` = 80th term
Through mark for 80, draw a parallel line to x-axis which meets the curve; then from the curve draw a vertical line which meets the x-axis at the mark of 157.5.
ii. Since, number of terms = 160
Lower quartile (Q1) = `(160/4)` = 40th term = 152
Upper quartile (Q3) = `((3 xx 160)/4)` = 120th term = 164
Inner Quartile range = Q3 – Q1
= 164 – 152
= 12
iii. Through mark for 172 on x-axis, draw a vertical line which meets the curve; then from the curve draw a horizontal line which meets the y-axis at the mark of 145.
The number of students whose height is above 172 cm = 160 – 144 = 16
APPEARS IN
संबंधित प्रश्न
Marks obtained by 40 students in a short assessment is given below, where a and b are two missing data.
| Marks | 5 | 6 | 7 | 8 | 9 |
| Number of Students | 6 | a | 16 | 13 | b |
If the mean of the distribution is 7.2, find a and b.
- Find the mean of 7, 11, 6, 5 and 6.
- If each number given in (a) is diminished by 2; find the new value of mean.
The contents of 100 match boxes were checked to determine the number of matches they contained.
| No. of matches | 35 | 36 | 37 | 38 | 39 | 40 | 41 |
| No. of boxes | 6 | 10 | 18 | 25 | 21 | 12 | 8 |
- Calculate, correct to one decimal place, the mean number of matches per box.
- Determine, how many extra matches would have to be added to the total contents of the 100 boxes to bring the mean up to exactly 39 matches.
Find the mode and the median of the following frequency distributions.
| x | 10 | 11 | 12 | 13 | 14 | 15 |
| f | 1 | 4 | 7 | 5 | 9 | 3 |
The median of observations 10, 11, 13, 17, x + 5, 20, 22, 24 and 53 (arranged in ascending order) is 18; find the value of x.
If the mean of 6, 4, 7, p and 10 is 8, find the value of p.
The mean of marks scored by 100 students was found to be 40, later on, it was discovered that a score of 53 was misread as 83. Find the correct mean.
The mean of five numbers is 27. If one number is excluded, the mean of the remaining numbers is 25. Find the excluded number.
Find the mean and the median of: 10,12, 12, 15, 15, 17, 18, 18, 18 and 19
Which of the following has the same mean, median and mode?
