Advertisements
Advertisements
प्रश्न
The following distribution represents the height of 160 students of a school.
| Height (in cm) | No. of Students |
| 140 – 145 | 12 |
| 145 – 150 | 20 |
| 150 – 155 | 30 |
| 155 – 160 | 38 |
| 160 – 165 | 24 |
| 165 – 170 | 16 |
| 170 – 175 | 12 |
| 175 – 180 | 8 |
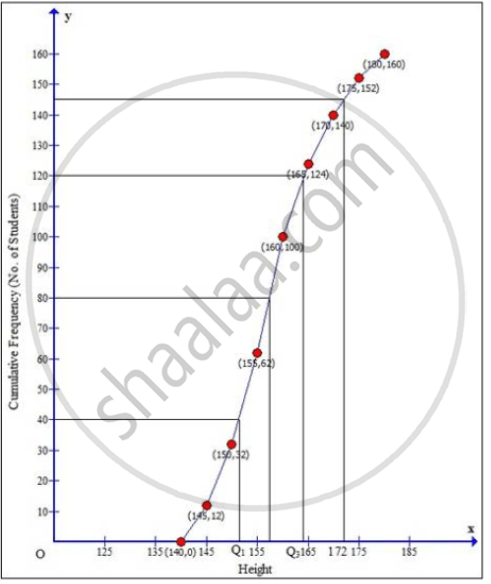
Draw an ogive for the given distribution taking 2 cm = 5 cm of height on one axis and 2 cm = 20 students on the other axis. Using the graph, determine:
- The median height.
- The interquartile range.
- The number of students whose height is above 172 cm.
उत्तर
| Height (in cm) |
No. of students |
Cumulative frequency |
| 140 – 145 | 12 | 12 |
| 145 – 150 | 20 | 32 |
| 150 – 155 | 30 | 62 |
| 155 – 160 | 38 | 100 |
| 160 – 165 | 24 | 124 |
| 165 – 170 | 16 | 140 |
| 170 – 175 | 12 | 152 |
| 175 – 180 | 8 | 160 |
| N = 160 |
Taking height of student along x-axis and cumulative frequency along y-axis we will draw an ogive.

i. ∴ Median = `160/2` = 80th term
Through mark for 80, draw a parallel line to x-axis which meets the curve; then from the curve draw a vertical line which meets the x-axis at the mark of 157.5.
ii. Since, number of terms = 160
Lower quartile (Q1) = `(160/4)` = 40th term = 152
Upper quartile (Q3) = `((3 xx 160)/4)` = 120th term = 164
Inner Quartile range = Q3 – Q1
= 164 – 152
= 12
iii. Through mark for 172 on x-axis, draw a vertical line which meets the curve; then from the curve draw a horizontal line which meets the y-axis at the mark of 145.
The number of students whose height is above 172 cm = 160 – 144 = 16
APPEARS IN
संबंधित प्रश्न
Calculate the mean of the following distribution :
| Class Interval | 0-10 | 10-20 | 20-30 | 30-40 | 40-50 | 50-60 |
| Frequency | 8 | 5 | 12 | 35 | 24 | 16 |
Draw a histogram from the following frequency distribution and find the mode from the graph:
| Class | 0-5 | 5-10 | 10-15 | 15-20 | 20-25 | 25-30 |
| Frequency | 2 | 5 | 18 | 14 | 8 | 5 |
Marks obtained by 40 students in a short assessment is given below, where a and b are two missing data.
| Marks | 5 | 6 | 7 | 8 | 9 |
| Number of Students | 6 | a | 16 | 13 | b |
If the mean of the distribution is 7.2, find a and b.
In a school, 100 pupils have heights as tabulate below:
| Height (in cm) | No. of pupils |
| 121 – 130 | 12 |
| 131 – 140 | 16 |
| 141 – 150 | 30 |
| 151 – 160 | 20 |
| 161 – 170 | 14 |
| 171 – 180 | 8 |
Find the median height by drawing an ogive.
The mean of 1, 7, 5, 3, 4 and 4 is m. The numbers 3, 2, 4, 2, 3, 3 and p have mean m – 1 and median q. Find p and q.
The marks obtained by 120 students in a mathematics test is given below:
| Marks | No. of students |
| 0 – 10 | 5 |
| 10 – 20 | 9 |
| 20 – 30 | 16 |
| 30 – 40 | 22 |
| 40 – 50 | 26 |
| 50 – 60 | 18 |
| 60 – 70 | 11 |
| 70 – 80 | 6 |
| 80 – 90 | 4 |
| 90 – 100 | 3 |
Draw an ogive for the given distributions on a graph sheet. Use a suitable scale for your ogive. Use your ogive to estimate:
- the median
- the number of student who obtained more than 75% in test.
- the number of students who did not pass in the test if the pass percentage was 40.
- the lower quartile.
Estimate the median, the lower quartile and the upper quartile of the following frequency distribution by drawing an ogive:
| Marks(more than) | 90 | 80 | 70 | 60 | 50 | 40 | 30 | 20 | 10 | 0 |
| No. of students | 6 | 13 | 22 | 34 | 48 | 60 | 70 | 78 | 80 | 80 |
The rainfall (in mm) in a city on 7 days of a certain week is recorded as follows:
| Day: | Mon | Tue | Wed | Thus | Fri | Sat | Sun |
| Rainfall (in mm): | 0.5 | 2.7 | 2.6 | 0.5 | 2 | 5.8 | 1.5 |
Find the total and average (mean) rainfall for the week.
The mean of 5 numbers is 27. If one new number is included, the new mean is 25. Find the included number.
Find the mean of: first eight natural numbers
