Advertisements
Advertisements
प्रश्न
In a school, 100 pupils have heights as tabulate below:
| Height (in cm) | No. of pupils |
| 121 – 130 | 12 |
| 131 – 140 | 16 |
| 141 – 150 | 30 |
| 151 – 160 | 20 |
| 161 – 170 | 14 |
| 171 – 180 | 8 |
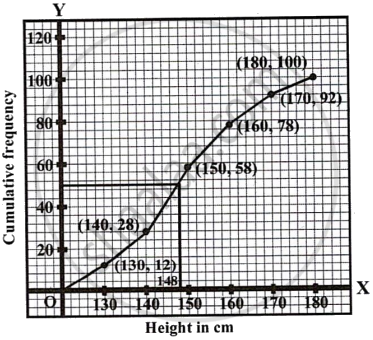
Find the median height by drawing an ogive.
उत्तर
| Exclusive class Intervals |
Height (in cm) |
No. of pupils |
Cumulative Frequency |
| 120.5 – 130.5 | 121 – 130 | 12 | 12 |
| 130.5 – 140.5 | 131 – 140 | 16 | 28 |
| 140.5 – 150.5 | 141 – 150 | 30 | 58 |
| 150.5 – 160.5 | 151 – 160 | 20 | 78 |
| 160.5 – 170.5 | 161 – 170 | 14 | 92 |
| 170.5 – 180.5 | 171 – 180 | 8 | 100 |
No. of terms = 100 = N
∴ Median = `100/2` = 50th term

Plotting the points (120.5, 0), (130.5, 12), (140.5, 28), (150.5, 58), (160.5, 78), (170.5, 92), (180.5, 100) on graph paper and join them by free hand curve gives the required ogive.
Through mark 50, draw a line parallel to x-axis which meets the curve at A. From A, draw perpendicular to x-axis which meets x-axis at B is the median which is 148 cm.
APPEARS IN
संबंधित प्रश्न
Find the mode and the median of the following frequency distribution:
| x | 10 | 11 | 12 | 13 | 14 | 15 |
| f | 1 | 4 | 7 | 5 | 9 | 3 |
If each number given in (a) is diminished by 2, find the new value of mean.
A boy scored following marks in various class tests during a term; each test being marked out of 20.
15, 17, 16, 7, 10, 12, 14, 16, 19, 12 and 16
What are his modal marks?
The marks of 20 students in a test were as follows:
2, 6, 8, 9, 10, 11, 11, 12, 13, 13, 14, 14, 15, 15, 15, 16, 16, 18, 19 and 20.
Calculate:
- the mean
- the median
- the mode
Find the mode of the following frequency distribution:
| Pocket money per week in Rs | 25 | 50 | 75 | 100 | 125 | 150 |
| No. of students | 4 | 7 | 13 | 18 | 6 | 2 |
The marks of 200 students in a test is given below :
| Marks% | 10-19 | 20-29 | 30-39 | 40-49 | 50-59 | 60-69 | 70-79 | 80-89 |
| No. of Students | 7 | 11 | 20 | 46 | 57 | 37 | 15 | 7 |
Draw an ogive and find
(i) the median
(ii) the number of students who scored more than 35% marks
Estimate the median, the lower quartile and the upper quartile of the following frequency distribution by drawing an ogive:
| Marks (less than) | 10 | 20 | 30 | 40 | 50 | 60 | 70 | 80 |
| No. of students | 5 | 15 | 30 | 54 | 72 | 86 | 94 | 100 |
The following observations have been arranged in ascending order. If the median of the data is 78, find the value of x.
44, 47, 63, 65, x + 13, 87, 93, 99, 110.
Find the median of 3.2, 4.8, 5.6, 5.6, 7.3, 8.9 and 9.1
Find the median of the given data: 36, 44, 86, 31, 37, 44, 86, 35, 60, 51
