Advertisements
Advertisements
प्रश्न
From the following cumulative frequency table, draw ogive and then use it to find:
- Median
- Lower quartile
- Upper quartile
| Marks (less than) | 10 | 20 | 30 | 40 | 50 | 60 | 70 | 80 | 90 | 100 |
| Cumulative frequency | 5 | 24 | 37 | 40 | 42 | 48 | 70 | 77 | 79 | 80 |
उत्तर
| Marks (less than) | Cumulative frequency |
| 10 | 5 |
| 20 | 24 |
| 30 | 37 |
| 40 | 40 |
| 50 | 42 |
| 60 | 48 |
| 70 | 70 |
| 80 | 77 |
| 90 | 79 |
| 100 | 80 |
Number of terms = 80
Median = 40th term

i. Median = Through 40th term mark draw a line parallel to the x-axis which meets the curve at A. From A, draw a perpendicular to x-axis which meets it at B.
Value of B is the median = 40
ii. Lower quartile (Q1) = 20th term = 18
iii. Upper quartile (Q3) = 60th term = 66
APPEARS IN
संबंधित प्रश्न
Marks obtained by 40 students in a short assessment is given below, where a and b are two missing data.
| Marks | 5 | 6 | 7 | 8 | 9 |
| Number of Students | 6 | a | 16 | 13 | b |
If the mean of the distribution is 7.2, find a and b.
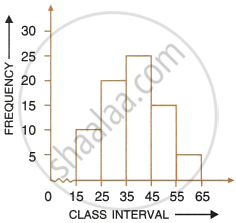
Using the information given in the adjoining histogram, calculate the mean.
A boy scored following marks in various class tests during a term; each test being marked out of 20.
15, 17, 16, 7, 10, 12, 14, 16, 19, 12 and 16
What are his median marks?
At a shooting competition the score of a competitor were as given below:
| Score | 0 | 1 | 2 | 3 | 4 | 5 |
| No. of shots | 0 | 3 | 6 | 4 | 7 | 5 |
- What was his modal score?
- What was his median score?
- What was his total score?
- What was his mean score?
Draw an ogive for the data given below and from the graph determine:
- the median marks
- the number of students who obtained more than 75% marks
| Marks | No. of students |
| 0 – 9 | 5 |
| 10 – 19 | 9 |
| 20 – 29 | 16 |
| 30 – 39 | 22 |
| 40 – 49 | 26 |
| 50 – 59 | 18 |
| 60 – 69 | 11 |
| 70 – 79 | 6 |
| 80 – 89 | 4 |
| 90 – 99 | 3 |
Find the rnedian of the first 15 whole numbers .
Find the median of:
241, 243, 347, 350, 327, 299, 261, 292, 271, 258 and 257
Find the mean of first six natural numbers.
Find the median of the given data: 35, 25, 34, 36, 45, 18, 28
The median of any data lies between the ______ and ______ observations.
