Advertisements
Advertisements
प्रश्न
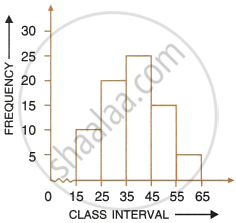
Using the information given in the adjoining histogram, calculate the mean.

उत्तर
| C.I. | Frequency | Mid value x | fx |
| 15 – 25 | 10 | 20 | 200 |
| 25 – 35 | 20 | 30 | 600 |
| 35 – 45 | 25 | 40 | 1000 |
| 45 – 55 | 15 | 50 | 750 |
| 55 – 65 | 5 | 60 | 300 |
| Total | 75 | 2850 |
`barx = (sumf_x)/(sumf)`
= `2850/75`
= 38
APPEARS IN
संबंधित प्रश्न
Calculate the mean of the distribution given below using the shortcut method.
| Marks | 11-20 | 21-30 | 31-40 | 41-50 | 51-60 | 61-70 | 71-80 |
| No. of students | 2 | 6 | 10 | 12 | 9 | 7 | 4 |
The mean of the following distribution in 52 and the frequency of class interval 30-40 'f' find f
| C.I | 10-20 | 20-30 | 30-40 | 40-50 | 50-60 | 60-70 | 70-80 |
| freq | 5 | 3 | f | 7 | 2 | 6 | 13 |
The monthly income of a group of 320 employees in a company is given below:
| Monthly income (thousands) | No. of employees |
| 6-7 | 20 |
| 7-8 | 45 |
| 8-9 | 65 |
| 9-10 | 95 |
| 10-11 | 60 |
| 11-12 | 30 |
| 12-13 | 5 |
Draw an ogive of the distribution on a graph paper taking 2 cm = Rs. 1000 on one axis and 2 cm = 50 employees on the other axis. From the graph detemine:
- the median wage.
- number of employee whose income is below Rs. 8,500.
- If salary of a senior employee is above Rs. 11,500, find the number of senior employee in the company.
- the upper quartile.
Calculate the mean of the distribution, given below using the short cut method:
| Marks | 11 – 20 | 21 – 30 | 31 – 40 | 41 – 50 | 51 – 60 | 61 – 70 | 71 – 80 |
| No. of students | 2 | 6 | 10 | 12 | 9 | 7 | 4 |
In a case of 40 students, marks obtained by the students in a class test (out of 10) are given below:
| Marks | 1 | 2 | 3 | 4 | 5 | 6 | 7 | 8 | 9 | 10 |
| Number of students | 1 | 2 | 3 | 3 | 6 | 10 | 5 | 4 | 3 | 3 |
Calculate the following for the given distribution:
(i) Median
(ii) Mode
Following 10 observations are arranged in ascending order as follows.
2, 3, 5, 9, x + 1, x + 3, 14, 16, 19, 20
If the median of the data is 11, find the value of x.
Find the mean of all odd numbers from 5 to 20. Find the new mean when each number is multiplied by 4.
Find the median of:
241, 243, 347, 350, 327, 299, 261, 292, 271, 258 and 257
The following observations have been arranged in ascending order. If the median of the data is 78, find the value of x.
44, 47, 63, 65, x + 13, 87, 93, 99, 110.
The mean of a certain number of observations is 32. Find the resulting mean, if the observation is, increased by 60%.
