Advertisements
Advertisements
प्रश्न
In a school, 100 pupils have heights as tabulate below:
| Height (in cm) | No. of pupils |
| 121 – 130 | 12 |
| 131 – 140 | 16 |
| 141 – 150 | 30 |
| 151 – 160 | 20 |
| 161 – 170 | 14 |
| 171 – 180 | 8 |
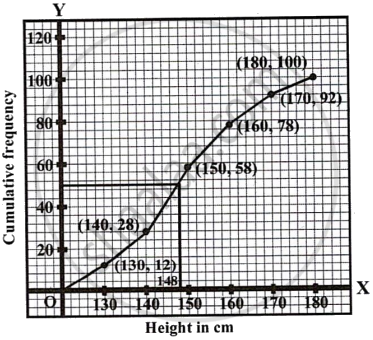
Find the median height by drawing an ogive.
उत्तर
| Exclusive class Intervals |
Height (in cm) |
No. of pupils |
Cumulative Frequency |
| 120.5 – 130.5 | 121 – 130 | 12 | 12 |
| 130.5 – 140.5 | 131 – 140 | 16 | 28 |
| 140.5 – 150.5 | 141 – 150 | 30 | 58 |
| 150.5 – 160.5 | 151 – 160 | 20 | 78 |
| 160.5 – 170.5 | 161 – 170 | 14 | 92 |
| 170.5 – 180.5 | 171 – 180 | 8 | 100 |
No. of terms = 100 = N
∴ Median = `100/2` = 50th term

Plotting the points (120.5, 0), (130.5, 12), (140.5, 28), (150.5, 58), (160.5, 78), (170.5, 92), (180.5, 100) on graph paper and join them by free hand curve gives the required ogive.
Through mark 50, draw a line parallel to x-axis which meets the curve at A. From A, draw perpendicular to x-axis which meets x-axis at B is the median which is 148 cm.
APPEARS IN
संबंधित प्रश्न
Using a graph paper draw a histogram of the given distribution showing the number of runs scored by 50 batsmen. Estimate the mode of the data:
| Runs scored |
3000- 4000 |
4000- 5000 |
5000- 6000 |
6000- 7000 |
7000- 8000 |
8000- 9000 |
9000- 10000 |
| No. of batsmen |
4 | 18 | 9 | 6 | 7 | 2 | 4 |
Attempt this question on graph paper.
| Age (yrs ) | 5-15 | 15-25 | 25-35 | 35-45 | 45-55 | 55-65 | 65-75 |
| No.of casualties | 6 | 10 | 15 | 13 | 24 | 8 | 7 |
(1) Construct the 'less than' Cumulative frequency curve for the above data. using 2 cm =10 years on one axis and 2 cm =10 casualties on the other.
(2)From your graph determine :
(a)the median
(b)the lower quartile
The data on the number of patients attending a hospital in a month are given below. Find the average (mean) number of patients attending the hospital in a month by using the shortcut method. Take the assumed mean as 45. Give your answer correct to 2 decimal places.
| Number of patients | 10 - 20 | 20 - 30 | 30 - 40 | 40 - 50 | 50 - 60 | 60 - 70 |
| Number of Days | 5 | 2 | 7 | 9 | 2 | 5 |
If the mean of 11 , 14 , p , 26 , 10 , 12 , 18 , 6 is 15, find p.
Find the mode of the following frequency distribution:
| Variate | 20 | 21 | 22 | 23 | 24 | 25 | 26 |
| Frequency | 21 | 20 | 26 | 35 | 22 | 13 | 10 |
Find the mode of the following frequency distribution:
| Hrs. Spent daily in studies | 3 | 3.5 | 4 | 4.5 | 5 | 5.5 | 6 | 6.5 |
| No. of students | 8 | 7 | 3 | 5 | 10 | 6 | 3 | 4 |
Find the median of the following frequency distribution :
| Weight(kg) | 36 | 38 | 40 | 42 | 44 |
| No. of students | 11 | 26 | 29 | 24 | 10 |
The following data have been arranged in ascending order. If their median is 63, find the value of x.
34, 37, 53, 55, x, x + 2, 77, 83, 89 and 100.
The mean of a certain number of observations is 32. Find the resulting mean, if the observation is, decreased by 7
Find the mean and the median of: 0.5, 5.6, 3.8, 4.9, 2.7 and 4.4
