Advertisements
Advertisements
प्रश्न
Draw a histogram from the following frequency distribution and find the mode from the graph:
| Class | 0-5 | 5-10 | 10-15 | 15-20 | 20-25 | 25-30 |
| Frequency | 2 | 5 | 18 | 14 | 8 | 5 |
उत्तर १
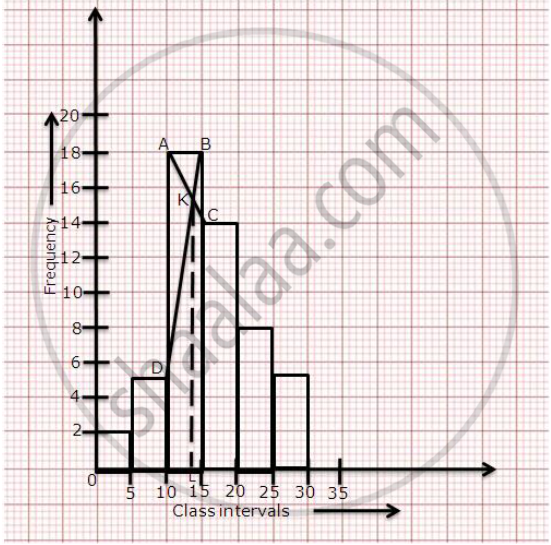
Steps for calculation of mode.
(1) Mark the endpoints of the upper corner of the rectangle with maximum frequency
as A and B.
(2) Mark the inner corner of adjacent rectangles as C and D.
(3) Join AC and BD to intersect at K. From K, draw KL perpendicular to the x-axis.
(4) The value of L on the x-axis represents the mode. Thus, Mode = 13
उत्तर २
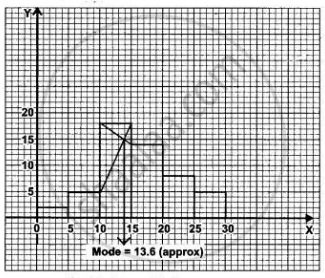
Mode = 13·6
APPEARS IN
संबंधित प्रश्न
Calculate the mean of the following distribution using step deviation method.
| Marks | 0-10 | 10-20 | 20-30 | 30-40 | 40-50 | 50-60 |
| Number of students |
10 | 9 | 25 | 0 | 16 | 10 |
If each number given in (a) is diminished by 2, find the new value of mean.
The mean of the number 6, ‘y’, 7, ‘x’ and 14 is 8. Express ‘y’ in terms of ‘x’.
Find the rnedian of the first 15 whole numbers .
Estimate the median, the lower quartile and the upper quartile of the following frequency distribution by drawing an ogive:
| Marks(more than) | 90 | 80 | 70 | 60 | 50 | 40 | 30 | 20 | 10 | 0 |
| No. of students | 6 | 13 | 22 | 34 | 48 | 60 | 70 | 78 | 80 | 80 |
Find the median of 21, 21, 22, 23, 23, 24, 24, 24, 24, 25 and 25
3, 8, 10, x, 14, 16, 18, 20 are in the ascending order and their median is 13. Calculate the numerical value of x.
Find the median of the given data: 36, 44, 86, 31, 37, 44, 86, 35, 60, 51
An incomplete frequency distribution is given below
| Variate | Frequency |
| 10 – 20 | 12 |
| 20 – 30 | 30 |
| 30 – 40 | ? |
| 40 – 50 | 65 |
| 50 – 60 | 45 |
| 60 – 70 | 25 |
| 70 – 80 | 18 |
| Total | 229 |
Median value is 46, the missing frequency is:
The median of the following observations arranged in ascending order is 64. Find the value of x:
27, 31, 46, 52, x, x + 4, 71, 79, 85, 90
