Advertisements
Advertisements
प्रश्न
The marks obtained by 200 students in an examination are given below :
| Marks | 0-10 | 10-20 | 20-30 | 30-40 | 40-50 | 50-60 | 60-70 | 70-80 | 80-90 | 90-100 |
| No.of students | 5 | 10 | 11 | 20 | 27 | 38 | 40 | 29 | 14 | 6 |
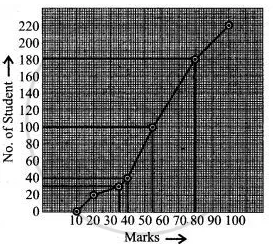
Using a graph paper, draw an Ogive for the above distribution. Use your Ogive to estimate:
(i) the median;
(ii) the lower quartile;
(iii) the number of students who obtained more than 80% marks in the examination and
(iv) the number of students who did not pass, if the pass percentage was 35.
Use the scale as 2 cm = 10 marks on one axis and 2 cm = 20 students on the other axis.
उत्तर १
We construct cumulative frequency table of the given distribution :
| Marks | No. of students (f) | Cumulative Frequency |
| 0-10 | 5 | 5 |
| 10-20 | 10 | 15 |
| 20-30 | 11 | 26 |
| 30-40 | 20 | 46 |
| 40-50 | 27 | 73 |
| 50-60 | 38 | 111 |
| 60-70 | 40 | 151 |
| 70-80 | 29 | 180 |
| 80-90 | 14 | 194 |
| 90-100 | 6 | 200 |
Take a graph paper and draw both the axes.
On the x - axis , take a scale of 1cm= 20 to represent the marks.
On the y - axis , take a scale of 1 cm =50 to represent the no. of students.
Now, plot the points (10 ,5) ,(20 ,15) ,(30 ,26) ,( 40 ,46) ,(50 ,73) ,(60 ,111), (70 ,151) ,(80 ,180) ,(90 ,194) ,(100 ,200) .
Join them by a smooth curve to get the ogive.

(i) No. of terms = 200
∴ Median = `(100 + 101)/2` = 100.5th term
Through mark of 100.5 on y-axis draw a line parallel to x-axis which meets the curve at A. From A, draw a perpendicular to x-axis which meets it at B.
The value of B is the median which is 58.5.
(ii) Lower Quartile (Q1) = `n/4 = 200/4` = 50th term
Through mark of 50 on y-axis draw a line parallel to x-axis which meets the curve at P. From P, draw a perpendicular to x-axis which meets it at Q.
The value of Q is the lower quartile which is 41 .
(iii) From marks = 80 draw a line parallel to y-axis and meet the curve at R. From R, Draw a perpendicular on y-axis which meets it at S. The difference of the value obtained when subtracted from 200 gives the number of students who scored more than 80%.
⇒ 200 - 180 = 20
20 students scored more than 80%
उत्तर २
| Less than | C.F. | Points |
| 10 | 5 | (10, 5) |
| 20 | 15 | (20, 15) |
| 30 | 26 | (30, 26) |
| 40 | 46 | (40, 46) |
| 50 | 73 | (50, 73) |
| 60 | 111 | (60, 111) |
| 70 | 151 | (70, 151) |
| 80 | 180 | (80, 180) |
| 90 | 194 | (90, 194) |
| 100 | 200 | (100, 200) |

(i) Median = `"N"/(2) = (200)/(2)`
= 100 → On seeing the corresponding value.
Median = 57
(ii) Q1 = `"N"/(4) = (200)/(4)`
= 50 → On seeing the corresponding value.
= 38
(iii) 200 - 180 = 20 students
(iv) 38 students did not pass.
APPEARS IN
संबंधित प्रश्न
The following are the marks obtained by 70 boys in a class test:
| Marks | No. of boys |
| 30 – 40 | 10 |
| 40 – 50 | 12 |
| 50 – 60 | 14 |
| 60 – 70 | 12 |
| 70 – 80 | 9 |
| 80 – 90 | 7 |
| 90 – 100 | 6 |
Calculate the mean by:
Step-deviation method
A boy scored following marks in various class tests during a term; each test being marked out of 20.
15, 17, 16, 7, 10, 12, 14, 16, 19, 12 and 16
What are his total marks?
Find the mean, median and mode of the following marks obtained by 16 students in a class test marked out of 10 marks:
0, 0, 2, 2, 3, 3, 3, 4, 5, 5, 5, 5, 6, 6, 7 and 8.
Find the mean of first 10 prime numbers.
The weights of 11 students in a class are 36 kg, 45 kg, 44 kg, 37 kg, 36 kg, 41 kg, 45 kg, 43 kg, 39 kg, 42 kg and 40 kg. Find the median of their weights.
Find the median of:
63, 17, 50, 9, 25, 43, 21, 50, 14 and 34
Out of 10 students, who appeared in a test, three secured less than 30 marks and 3 secured more than 75 marks. The marks secured by the remaining 4 students are 35, 48, 66 and 40. Find the median score of the whole group.
The following observations have been arranged in ascending order. If the median of these observations is 58, find the value of x.
24, 27, 43, 48, x - 1, x + 3, 68, 73, 80, 90
Find the mean of: all prime numbers between 20 and 40.
The median class for the given distribution is:
| Class Interval | 1 - 5 | 6 - 10 | 11 - 15 | 16 - 20 |
| Cumulative Frequency | 2 | 6 | 11 | 18 |
