Advertisements
Advertisements
Question
The ages of 37 students in a class are given in the following table:
| Age (in years) | 11 | 12 | 13 | 14 | 15 | 16 |
| Frequency | 2 | 4 | 6 | 10 | 8 | 7 |
Solution
| Age (in years) |
Frequency | Cumulative Frequency |
| 11 | 2 | 2 |
| 12 | 4 | 6 |
| 13 | 6 | 12 |
| 14 | 10 | 22 |
| 15 | 8 | 30 |
| 16 | 7 | 37 |
Number of terms = 37
Median = `(37 + 1^(th))/2` term = 19th term
Median = 14
APPEARS IN
RELATED QUESTIONS
The distribution below gives the weights of 30 students of a class. Find the median weight of the students.
| Weight (in kg) | 40−45 | 45−50 | 50−55 | 55−60 | 60−65 | 65−70 | 70−75 |
| Number of students | 2 | 3 | 8 | 6 | 6 | 3 | 2 |
For a certain frequency distribution, the values of Assumed mean (A) = 1300, `sumf_id_i` = 900 and `sumfi` = 100. Find the value of mean (`barx`) .
If the median of the following data is 32.5, find the missing frequencies.
| Class interval: | 0 - 10 | 10 - 20 | 20 - 30 | 30 - 40 | 40 - 50 | 50 - 60 | 60 - 70 | Total |
| Frequency: | f1 | 5 | 9 | 12 | f2 | 3 | 2 | 40 |
In the following data the median of the runs scored by 60 top batsmen of the world in one-day international cricket matches is 5000. Find the missing frequencies x and y.
| Runs scored | 2500 – 3500 | 3500 – 4500 | 4500 – 5500 | 5500 – 6500 | 6500 – 7500 | 7500 - 8500 |
| Number of batsman | 5 | x | y | 12 | 6 | 2 |
A data has 25 observations arranged in a descending order. Which observation represents the median?
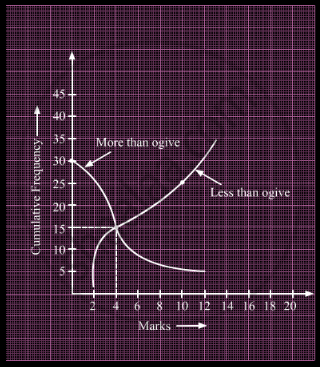
What is the value of the median of the data using the graph in the following figure of less than ogive and more than ogive?

Write the median class of the following distribution:
| Class-interval: | 0−10 | 10−20 | 20−30 | 30−40 | 40−50 | 50−60 | 60−70 |
| Frequency: | 4 | 4 | 8 | 10 | 12 | 8 | 4 |
If 35 is removed from the data, 30, 34, 35, 36, 37, 38, 39, 40 then the median increases by ______.
The Median when it is given that mode and mean are 8 and 9 respectively, is ______.
Consider the following frequency distribution:
| Class | 0 – 6 | 6 – 12 | 12 – 18 | 18 – 24 | 24 – 30 |
| Frequency | 12 | 10 | 15 | 8 | 11 |
The median class is:
