Advertisements
Online Mock Tests
Chapters
2: Banking (Recurring Deposit Account)
3: Shares and Dividend
4: Linear Inequations (In one variable)
5: Quadratic Equations
6: Solving (simple) Problems (Based on Quadratic Equations)
7: Ratio and Proportion (Including Properties and Uses)
8: Remainder and Factor Theorems
9: Matrices
10: Arithmetic Progression
11: Geometric Progression
12: Reflection
13: Section and Mid-Point Formula
14: Equation of a Line
15: Similarity (With Applications to Maps and Models)
16: Loci (Locus and Its Constructions)
17: Circles
18: Tangents and Intersecting Chords
19: Constructions (Circles)
20: Cylinder, Cone and Sphere
21: Trigonometrical Identities
22: Height and Distances
▶ 23: Graphical Representation
24: Measure of Central Tendency(Mean, Median, Quartiles and Mode)
25: Probability
![Selina solutions for Mathematics [English] Class 10 ICSE chapter 23 - Graphical Representation - Shaalaa.com](/images/mathematics-english-class-10-icse_6:8bf8c01058454f579d37da35940563b5.png "Selina solutions for Mathematics [English] Class 10 ICSE chapter 23 - Graphical Representation")
Advertisements
Solutions for Chapter 23: Graphical Representation
Below listed, you can find solutions for Chapter 23 of CISCE Selina for Mathematics [English] Class 10 ICSE.
Selina solutions for Mathematics [English] Class 10 ICSE 23 Graphical Representation Exercise 23 [Pages 348 - 349]
Draw histogram for the following frequency distributions:
| Class Interval | 0 – 10 | 10 – 20 | 20 – 30 | 30 – 40 | 40 – 50 | 50 – 60 |
| Frequency | 12 | 20 | 26 | 18 | 10 | 6 |
Draw histogram for the following frequency distributions:
| Class Interval | 10 – 16 | 16 – 22 | 22 – 28 | 28 – 34 | 34 – 40 |
| Frequency | 15 | 23 | 30 | 20 | 16 |
Draw histogram for the following frequency distributions:
| Class Interval | 30 – 39 | 40 – 49 | 50 – 59 | 60 – 69 | 70 – 79 |
| Frequency | 24 | 16 | 09 | 15 | 20 |
Draw histogram for the following frequency distributions:
| Class Marks | 16 | 24 | 32 | 40 | 48 | 56 | 64 |
| Frequency | 8 | 12 | 15 | 18 | 25 | 19 | 10 |
Draw a cumulative frequency curve (ogive) for the following distributions:
| Class Interval | 10 – 15 | 15 – 20 | 20 – 25 | 25 – 30 | 30 – 35 | 35 – 40 |
| Frequency | 10 | 15 | 17 | 12 | 10 | 8 |
Draw a cumulative frequency curve (ogive) for the following distributions:
| Class Interval | 10 – 19 | 20 – 29 | 30 – 39 | 40 – 49 | 50 – 59 |
| Frequency | 23 | 16 | 15 | 20 | 12 |
Draw an ogive for the following distributions:
| Marks obtained | less than 10 | less than 20 | less than 30 | less than 40 | less than 50 |
| No. of students | 8 | 25 | 38 | 50 | 67 |
Draw an ogive for the following distributions:
| Age in years (less than) | 10 | 20 | 30 | 40 | 50 | 60 | 70 |
| Cumulative frequency | 0 | 17 | 32 | 37 | 53 | 58 | 65 |
Construct a frequency distribution table for the numbers given below, using the class intervals 21-30, 31-40, ... etc.
75, 65, 57, 26, 33, 44, 58, 67, 75, 78, 43, 41, 31, 21, 32, 40, 62, 54, 69, 48, 47, 51, 38, 39, 43, 61, 63, 68, 53, 56, 49, 59, 37, 40, 68, 23, 28, 36 and 47.
Use the table obtained to draw:
- a histrogram
- an ogive
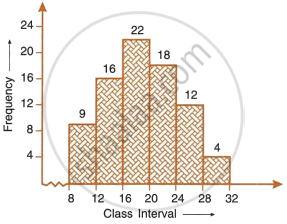
- Use the information given in the adjoining histogram to construct a frequency table.
- Use this table to construct an ogive.
| Class mark | 12.5 | 17.5 | 22.5 | 27.5 | 32.5 | 37.5 | 42.5 |
| Frequency | 12 | 17 | 22 | 27 | 30 | 21 | 16 |
- From the distribution, given above, construct a frequency table.
- Use the table obtained in part (a) to draw : (i) a histogram, (ii) an ogive.
Use graph paper for this question.
The table given below shows the monthly wages of some factory workers.
- Using the table, calculate the cumulative frequencies of workers.
- Draw a cumulative frequency curve.
Use 2 cm = ₹ 500, starting the origin at ₹ 6500 on x-axis, and 2 cm = 10 workers on the y-axis.
| Wages (in ₹.) | 6500-7000 | 7000-7500 | 7500-8000 | 8000-8500 | 8500-9000 | 9000-9500 | 9500-10000 |
| No. of workers | 10 | 18 | 22 | 25 | 17 | 10 | 8 |
The following table shows the distribution of the heights of a group of factory workers:
| Ht. (cm): | 150 – 155 | 155 – 160 | 160 – 165 | 165 – 170 | 170 – 175 | 175 – 180 | 180 – 185 |
| No. of workers: | 6 | 12 | 18 | 20 | 13 | 8 | 6 |
- Determine the cumulative frequencies.
- Draw the ‘less than’ cumulative frequency curve on graph paper. Use 2 cm = 5 cm height on one axis and 2 cm = 10 workers on the other.
Construct a frequency distribution table for the following distributions:
| Marks (less than) | 0 | 10 | 20 | 30 | 40 | 50 | 60 | 70 | 80 | 90 | 100 |
| Cumulative frequency | 0 | 7 | 28 | 54 | 71 | 84 | 105 | 147 | 180 | 196 | 200 |
Construct a frequency distribution table for the following distributions:
| Marks (more than) | 0 | 10 | 20 | 30 | 40 | 50 | 60 | 70 | 80 | 90 | 100 |
| Cumulative frequency | 100 | 87 | 65 | 55 | 42 | 36 | 31 | 21 | 18 | 7 | 0 |
Solutions for 23: Graphical Representation
Selina solutions for Mathematics [English] Class 10 ICSE chapter 23 - Graphical Representation
Shaalaa.com has the CISCE Mathematics Mathematics [English] Class 10 ICSE CISCE solutions in a manner that help students grasp basic concepts better and faster. The detailed, step-by-step solutions will help you understand the concepts better and clarify any confusion. Selina solutions for Mathematics Mathematics [English] Class 10 ICSE CISCE 23 (Graphical Representation) include all questions with answers and detailed explanations. This will clear students' doubts about questions and improve their application skills while preparing for board exams.
Further, we at Shaalaa.com provide such solutions so students can prepare for written exams. Selina textbook solutions can be a core help for self-study and provide excellent self-help guidance for students.
Concepts covered in Mathematics [English] Class 10 ICSE chapter 23 Graphical Representation are Median of Grouped Data, Ogives (Cumulative Frequency Graphs), Concepts of Statistics, Graphical Representation of Ogives, Finding the Mode from the Histogram, Finding the Mode from the Upper Quartile, Finding the Mode from the Lower Quartile, Finding the Median, upper quartile, lower quartile from the Ogive, Calculation of Lower, Upper, Inter, Semi-Inter Quartile Range, Concept of Median, Graphical Representation of Data as Histograms, Mean of Grouped Data, Mean of Ungrouped Data, Median of Ungrouped Data, Mode of Ungrouped Data, Mode of Grouped Data, Mean of Continuous Distribution, Graphical Representation of Data as Histograms, Median of Grouped Data, Ogives (Cumulative Frequency Graphs), Concepts of Statistics, Graphical Representation of Ogives, Finding the Mode from the Histogram, Finding the Mode from the Upper Quartile, Finding the Mode from the Lower Quartile, Finding the Median, upper quartile, lower quartile from the Ogive, Calculation of Lower, Upper, Inter, Semi-Inter Quartile Range, Concept of Median, Graphical Representation of Data as Histograms, Mean of Grouped Data, Mean of Ungrouped Data, Median of Ungrouped Data, Mode of Ungrouped Data, Mode of Grouped Data, Mean of Continuous Distribution, Graphical Representation of Data as Histograms.
Using Selina Mathematics [English] Class 10 ICSE solutions Graphical Representation exercise by students is an easy way to prepare for the exams, as they involve solutions arranged chapter-wise and also page-wise. The questions involved in Selina Solutions are essential questions that can be asked in the final exam. Maximum CISCE Mathematics [English] Class 10 ICSE students prefer Selina Textbook Solutions to score more in exams.
Get the free view of Chapter 23, Graphical Representation Mathematics [English] Class 10 ICSE additional questions for Mathematics Mathematics [English] Class 10 ICSE CISCE, and you can use Shaalaa.com to keep it handy for your exam preparation.
