Advertisements
Advertisements
Question
Draw a cumulative frequency curve (ogive) for the following distributions:
| Class Interval | 10 – 19 | 20 – 29 | 30 – 39 | 40 – 49 | 50 – 59 |
| Frequency | 23 | 16 | 15 | 20 | 12 |
Solution
The above distribution is discontinuous converting into continuous distribution, we get:
Adjustment factor = `("Lower limit of one class" - "Upper limit of previous class") / 2`
= `(20 - 19)/2`
= `1/2`
= 0.5
Subtract the adjustment factor (0.5) from all the lower limits and add the adjustment factor (0.5) to all the upper limits.
| Class Interval (Inclusive) | Class Interval (Exclusive) | Frequency | Cumulative Frequency |
| 10 – 19 | 9.5 – 19.5 | 23 | 23 |
| 20 – 29 | 19.5 – 29.5 | 16 | 39 |
| 30 – 39 | 29.5 – 39.5 | 15 | 54 |
| 40 – 49 | 39.5 – 49.5 | 20 | 74 |
| 50 – 59 | 49.5 – 59.5 | 12 | 86 |
| Total | 86 |
Steps of construction of ogive:
- Since, the scale on x-axis starts at 9.5, a break (kink) is shown near the origin on x-axis to indicate that the graph is drawn to scale beginning at 9.5.
- Take 2 cm = 10 units along the x-axis.
- Take 1 cm = 10 units along the y-axis.
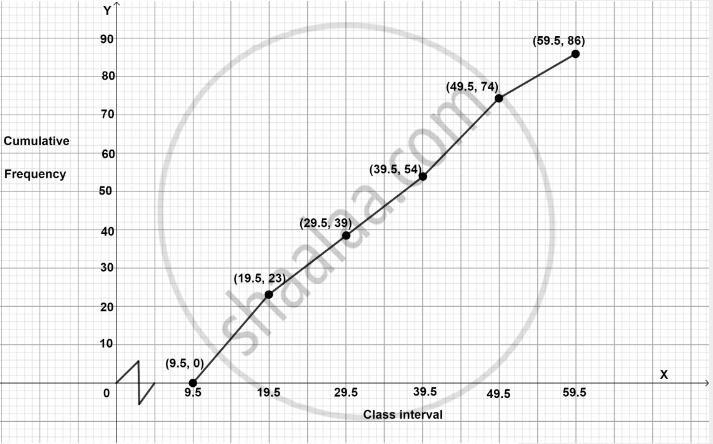
- Ogive always starts from a point on the x-axis, representing the lower limit of the first class. Mark point (9.5, 0).
- Take upper-class limits along the x-axis and corresponding cumulative frequencies along the y-axis, and mark the points (19.5, 23), (29.5, 39), (39.5, 54), (49.5, 74) and (59.5, 86).
- Join the points marked by a free-hand curve.
The required ogive is shown in the below figure:
APPEARS IN
RELATED QUESTIONS
The marks scored by 750 students in an examination are given in the form of a frequency distribution table:
| Marks | No. of students |
| 600 - 640 | 16 |
| 640 - 680 | 45 |
| 680 - 720 | 156 |
| 720 - 760 | 284 |
| 760 - 800 | 172 |
| 800 - 840 | 59 |
| 840 - 880 | 18 |
The annual profits earned by 30 shops of a shopping complex in a locality give rise to the following distribution:
| Profit (in lakhs in Rs) | Number of shops (frequency) |
| More than or equal to 5 More than or equal to 10 More than or equal to 15 More than or equal to 20 More than or equal to 25 More than or equal to 30 More than or equal to 35 |
30 28 16 14 10 7 3 |
Draw both ogives for the above data and hence obtain the median.
Find the correct answer from the alternatives given.
Cumulative frequencies in a grouped frequency table are useful to find ______.
Draw an ogive for the following :
| Class Interval | 10-19 | 20-29 | 30-39 | 40-49 | 50-59 |
| Frequency | 28 | 23 | 15 | 20 | 14 |
Draw an ogive for the following :
| Marks obtained | Less than 10 | Less than 20 | Less than 30 | Less than 40 | Less than 50 |
| No. of students | 8 | 22 | 48 | 60 | 75 |
Draw an ogive for the following :
| Age in years | Less than 10 | Less than 20 | Less than 30 | Less than 40 | Less than 50 |
| No. of people | 0 | 17 | 42 | 67 | 100 |
Draw an ogive for the following :
| Marks obtained | More than 10 | More than 20 | More than 30 | More than 40 | More than 50 |
| No. of students | 8 | 25 | 38 | 50 | 67 |
Prepare the cumulative frequency (less than types) table from the following distribution table :
| Class | 0-10 | 10-20 | 20-30 | 30-40 | 40-50 |
| Frequency | 2 | 3 | 7 | 8 | 5 |
The frequency distribution of scores obtained by 230 candidates in a medical entrance test is as ahead:
| Cost of living Index | Number of Months |
| 400 - 450 | 20 |
| 450 - 500 | 35 |
| 500 - 550 | 40 |
| 550 - 600 | 32 |
| 600 - 650 | 24 |
| 650 - 700 | 27 |
| 700 - 750 | 18 |
| 750 - 800 | 34 |
| Total | 230 |
Draw a cummulative polygon (ogive) to represent the above data.
Use graph paper for this question. The following table shows the weights in gm of a sample of 100 potatoes taken from a large consignment:
| Weight (gms) | Frequency |
| 50 - 60 | 8 |
| 60 - 70 | 10 |
| 70 - 80 | 12 |
| 80 - 90 | 16 |
| 90 - 100 | 18 |
| 100 - 110 | 14 |
| 110 - 120 | 12 |
| 120 - 130 | 10 |
(i) Calculate the cumulative frequencies.
(ii) Draw the cumulative frequency curve and form it determine the median weights of the potatoes.
