Advertisements
Advertisements
Question
Construct a frequency distribution table for the numbers given below, using the class intervals 21-30, 31-40, ... etc.
75, 65, 57, 26, 33, 44, 58, 67, 75, 78, 43, 41, 31, 21, 32, 40, 62, 54, 69, 48, 47, 51, 38, 39, 43, 61, 63, 68, 53, 56, 49, 59, 37, 40, 68, 23, 28, 36 and 47.
Use the table obtained to draw:
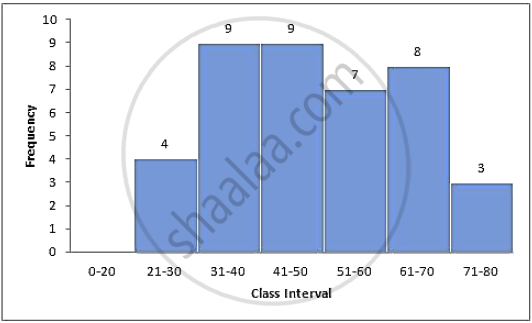
- a histrogram
- an ogive
Solution
| Class Interval | Tally | Frequency | c.f. |
| 21 – 30 | |||| | 4 | 4 |
| 31 – 40 | |||| |||| | 9 | 13 |
| 41 – 50 | |||| |||| | 9 | 22 |
| 51 – 60 | |||| || | 7 | 29 |
| 61 – 70 | |||| ||| | 8 | 37 |
| 71 – 80 | ||| | 3 | 40 |
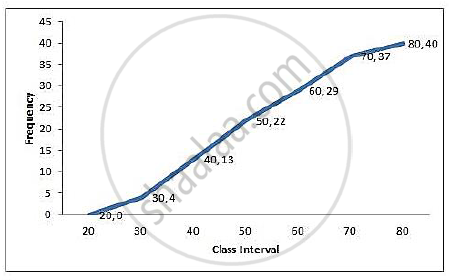
Plot the points (30, 4), (40, 13), (50, 22), (60, 29), (70, 37) and (80, 40) on the graph and join them with free hand to obtain an ogive.
APPEARS IN
RELATED QUESTIONS
The table shows the distribution of the scores obtained by 160 shooters in a shooting competition. Use a graph sheet and draw an ogive for the distribution. (Take 2 cm = 10 scores on the X-axis and 2 cm = 20 shooters on the Y-axis).
| Scores | 0-10 | 10-20 | 20-30 | 30-40 | 40-50 | 50-60 | 60-70 | 70-80 | 80-90 | 90-100 |
| No. of shooters |
9 | 13 | 20 | 26 | 30 | 22 | 15 | 10 | 8 | 7 |
Use your graph to estimate the following:
1) The median
2) The interquartile range.
3) The number of shooters who obtained a score of more than 85%.
Marks obtained by 200 students in an examination are given below:
| Marks | No. of students |
| 0 – 10 | 5 |
| 10 – 20 | 11 |
| 20 – 30 | 10 |
| 30 – 40 | 20 |
| 40 – 50 | 28 |
| 50 – 60 | 37 |
| 60 – 70 | 40 |
| 70 – 80 | 29 |
| 80 – 90 | 14 |
| 90 – 100 | 6 |
Draw an ogive for the given distribution taking 2 cm = 10 marks on one axis and 2 cm = 20 students on the other axis. Using the graph, determine:
- The median marks.
- The number of students who failed if minimum marks required to pass is 40.
- If scoring 85 and more marks are considered as grade one, find the number of students who secured grade one in the examination.
| Class mark | 12.5 | 17.5 | 22.5 | 27.5 | 32.5 | 37.5 | 42.5 |
| Frequency | 12 | 17 | 22 | 27 | 30 | 21 | 16 |
- From the distribution, given above, construct a frequency table.
- Use the table obtained in part (a) to draw : (i) a histogram, (ii) an ogive.
Use graph paper for this question.
The table given below shows the monthly wages of some factory workers.
- Using the table, calculate the cumulative frequencies of workers.
- Draw a cumulative frequency curve.
Use 2 cm = ₹ 500, starting the origin at ₹ 6500 on x-axis, and 2 cm = 10 workers on the y-axis.
| Wages (in ₹.) | 6500-7000 | 7000-7500 | 7500-8000 | 8000-8500 | 8500-9000 | 9000-9500 | 9500-10000 |
| No. of workers | 10 | 18 | 22 | 25 | 17 | 10 | 8 |
The following table shows the distribution of the heights of a group of factory workers:
| Ht. (cm): | 150 – 155 | 155 – 160 | 160 – 165 | 165 – 170 | 170 – 175 | 175 – 180 | 180 – 185 |
| No. of workers: | 6 | 12 | 18 | 20 | 13 | 8 | 6 |
- Determine the cumulative frequencies.
- Draw the ‘less than’ cumulative frequency curve on graph paper. Use 2 cm = 5 cm height on one axis and 2 cm = 10 workers on the other.
Income of 100 students of their parents is given as follows:
| Income (in thousand Rs.) |
No. of students (f) |
| 0 – 8 | 8 |
| 8 – 16 | 35 |
| 16 – 24 | 35 |
| 24 – 32 | 14 |
| 32 – 40 | 8 |
Draw an ogive for the given distribution on a graph sheet. Use a suitable scale for your exercise. Use your ogive to estimate:
- the median income.
- Calculate the income below which freeship will be awarded to students if their parents income is in the bottom 15%
- Mean income.
Marks obtained by 200 students in an examination are given below:
| Marks | 0 - 10 | 10 - 20 | 20 - 30 | 30 - 40 | 40 - 50 | 50 - 60 | 60 - 70 | 70 - 80 | 80 - 90 | 90 - 100 |
| Frequency | 5 | 11 | 10 | 20 | 28 | 37 | 40 | 29 | 14 | 6 |
Draw an ogive for the given distribution taking 2 cm = 10 marks on one axis and 2 cm = 20 students on the other axis. Using the graph, determine:
(i) The median marks
(ii) The number of students who failed if minimum marks required to pass is 40.
(iii) If scoring 85 and more marks is considered as grade one, find the number of students who secured grade one in the examination.
The daily wages of 160 workers in a building project are given below:
| Wages in ₹ | 0 - 10 | 10 - 20 | 20 - 30 | 30 - 40 | 40 - 50 | 50 - 60 | 60 - 70 | 70 - 80 |
| No. of Workers | 12 | 20 | 30 | 38 | 24 | 16 | 12 | 8 |
Using a graph paper, draw in Ogive for the above distribution.
Use your Ogive to estimate :
(i) the median wage of the workers.
(ii) the upper quartile wage of the workers
(iii) the lower quartile wages of the workers
(iv) the percentage of workers who earn more than ₹ 45 a day.
The marks obtained by 120 students in a test are given below:
| Marks | 0 - 10 | 10 - 20 | 20 - 30 | 30 - 40 | 40 - 50 | 50 - 60 | 60 - 70 | 70 - 80 | 80 - 90 | 90 - 100 |
| No. of Students | 5 | 9 | 16 | 22 | 26 | 18 | 11 | 6 | 4 | 3 |
Draw an ogive for the given distribution on a graph sheet.
Use suitable scale for ogive to estimate the following :
(i) the median.
(ii) The number of students who obtained more than 75% marks in the test.
The marks obtained by 100 students in a Mathematics test are given below:
| Marks | 0-10 | 10-20 | 20-30 | 30-40 | 40-50 | 50-60 | 60-70 | 70-80 | 80-90 | 90-100 |
| No. of Students | 3 | 7 | 12 | 17 | 23 | 14 | 9 | 6 | 5 | 4 |
Draw an ogive for the given distribution on a graph sheet.
Use a scale of 2 cm = 10 units on both axes.
Use the ogive to estimate the :
- median.
- lower quartile.
- number of students who obtained more than 85% marks in the test.
- number of students who did not pass in the test if the pass percentage was 35.
