Advertisements
Advertisements
Question
The histogram below represents the scores obtained by 25 students in a mathematics mental test. Use the data to:
- Frame a frequency distribution table.
- To calculate mean.
- To determine the Modal class.

Advertisements
Solution
i.
| Class interval | Frequency |
| 0 – 10 | 2 |
| 10 – 20 | 5 |
| 20 – 30 | 8 |
| 30 – 40 | 4 |
| 40 – 50 | 6 |
ii.
| Class interval | Frequency (f) | Mean value (x) | fx |
| 0 – 10 | 2 | 5 | 10 |
| 10 – 20 | 5 | 15 | 75 |
| 20 – 30 | 8 | 25 | 200 |
| 30 – 40 | 4 | 35 | 140 |
| 40 – 50 | 6 | 45 | 270 |
| `sumf = 25` | `sumf = 695` |
∴ Mean = `(sumfx)/(sumf)`
= `695/25`
= 27.8
iii. Here the maximum frequency is 8 which is corresponding to class 20 – 30.
Hence, the modal class is 20 – 30.
APPEARS IN
RELATED QUESTIONS
The weekly wages (in Rs) of 30 workers in a factory are.
830, 835, 890, 810, 835, 836, 869, 845, 898, 890, 820, 860, 832, 833, 855, 845, 804, 808, 812, 840, 885, 835, 835, 836, 878, 840, 868, 890, 806, 840
Using tally marks make a frequency table with intervals as 800 − 810, 810 − 820 and so on.
Draw histogram for the following frequency distributions:
| Class Interval | 10 – 16 | 16 – 22 | 22 – 28 | 28 – 34 | 34 – 40 |
| Frequency | 15 | 23 | 30 | 20 | 16 |
Find the correct answer from the alternatives given.
|
No. of trees planted by each student |
1 - 3 | 4 - 6 | 7 - 9 | 10 - 12 |
| No. of students | 7 | 8 | 6 | 4 |
The above data is to be shown by a frequency polygon. The coordinates of the points to show number of students in the class 4-6 are . . . .
Draw a histogram of the following data:
| Class interval: | 10−15 | 15−20 | 20−25 | 25−30 | 30−35 | 34−40 |
| Frequency: | 30 | 98 | 80 | 58 | 29 | 50 |
The following frequency distribution table shows marks obtained by 180 students in Mathematics examination.
| Marks | No. of students |
| 0 - 10 | 25 |
| 10 - 20 | x |
| 20 - 30 | 30 |
| 30 - 40 | 2x |
| 40 - 50 | 65 |
Find the value of x. Also draw a histogram representing the above information.
Construct a frequency polygon without using a histogram for the following frequency distribution :
| Class Mark | 10 | 15 | 20 | 25 | 30 | 35 | 40 |
| Frequency | 4 | 20 | 40 | 45 | 30 | 25 | 5 |
A graph that displays data that changes continuously over the periods of time is _________
Draw a histogram for the following data.
| Mid Value (x) | 15 | 25 | 35 | 45 | 55 | 65 | 75 |
| Frequency (f) | 12 | 24 | 30 | 18 | 26 | 10 | 8 |
Histogram shows the number of people owning the different number of books. Answer the question based on it.
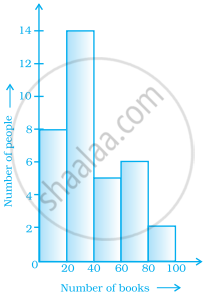
The total number of people surveyed is ______.
Prepare a histogram from the frequency distribution table obtained in question 93.
