Advertisements
Advertisements
Question
The mean of following numbers is 68. Find the value of ‘x’. 45, 52, 60, x, 69, 70, 26, 81 and 94. Hence, estimate the median.
Solution
Mean = `"Sum of all observations"/"Total number of observations"`
∴ `68 = (45 + 52 + 60 + x + 69 + 70 + 26 + 81 + 94)/9`
`=> 68 = (497 + x)/9`
`=>` 612 = 497 + x
`=>` x = 612 – 497
`=>` x = 115
Data in ascending order
26, 45, 52, 60, 69, 70, 81, 94, 115
Since the number of observations is odd, the median is the `((n + 1)/2)^(th)` observation
`=>` Median = `((9 + 1)/2)^(th)` observation = 5th observation.
Hence, the median is 69
APPEARS IN
RELATED QUESTIONS
The distribution below gives the weights of 30 students of a class. Find the median weight of the students.
| Weight (in kg) | 40−45 | 45−50 | 50−55 | 55−60 | 60−65 | 65−70 | 70−75 |
| Number of students | 2 | 3 | 8 | 6 | 6 | 3 | 2 |
If the median of the distribution given below is 28.5, find the values of x and y.
| Class interval | Frequency |
| 0 - 10 | 5 |
| 10 - 20 | x |
| 20 - 30 | 20 |
| 30 - 40 | 15 |
| 40 - 50 | y |
| 50 - 60 | 5 |
| Total | 60 |
The table below shows the salaries of 280 persons :
| Salary (In thousand Rs) | No. of Persons |
| 5 – 10 | 49 |
| 10 – 15 | 133 |
| 15 – 20 | 63 |
| 20 – 25 | 15 |
| 25 – 30 | 6 |
| 30 – 35 | 7 |
| 35 – 40 | 4 |
| 40 – 45 | 2 |
| 45 – 50 | 1 |
Calculate the median salary of the data.
An incomplete distribution is given below:
| Variable: | 10-20 | 20-30 | 30-40 | 40-50 | 50-60 | 60-70 | 70-80 |
| Frequency: | 12 | 30 | - | 65 | - | 25 | 18 |
You are given that the median value is 46 and the total number of items is 230.
(i) Using the median formula fill up missing frequencies.
(ii) Calculate the AM of the completed distribution.
The following table shows the daily wages of workers in a factory:
| Daily wages in (Rs) | 0 – 100 | 100 – 200 | 200 – 300 | 300 – 400 | 400 – 500 |
| Number of workers | 40 | 32 | 48 | 22 | 8 |
Find the median daily wage income of the workers.
Calculate the median from the following data:
| Height(in cm) | 135 - 140 | 140 - 145 | 145 - 150 | 150 - 155 | 155 - 160 | 160 - 165 | 165 - 170 | 170 - 175 |
| Frequency | 6 | 10 | 18 | 22 | 20 | 15 | 6 | 3 |
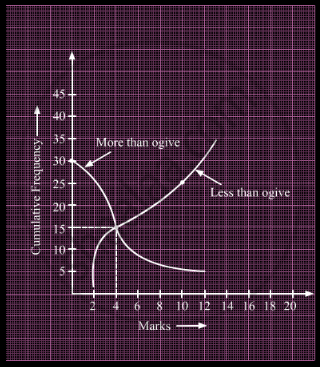
What is the value of the median of the data using the graph in the following figure of less than ogive and more than ogive?
Calculate the median of the following distribution:
| Weight (in nearest kg.) | No. of students |
| 46 | 7 |
| 48 | 5 |
| 50 | 8 |
| 52 | 12 |
| 53 | 10 |
| 54 | 2 |
| 55 | 1 |
The median of set of 9 distinct observations is 20.5. If each of the largest 4 observations of the set is increased by 2, then the median of the new set ______.
Consider the following frequency distribution:
| Class | 0 – 5 | 6 – 11 | 12 – 17 | 18 – 23 | 24 – 29 |
| Frequency | 13 | 10 | 15 | 8 | 11 |
The upper limit of the median class is:
