Advertisements
Advertisements
Question
Calculate the median of the following distribution:
| Weight (in nearest kg.) | No. of students |
| 46 | 7 |
| 48 | 5 |
| 50 | 8 |
| 52 | 12 |
| 53 | 10 |
| 54 | 2 |
| 55 | 1 |
Solution
The given variates (weights of students) are already in ascending order. We construct the cumulative frequency table as under:
| Variable (weight) |
Frequency (No.of Students) |
Cumulative frequency |
| 46 | 7 | 7 |
| 48 | 5 | 12 |
| 50 | 8 | 20 |
| 52 | 12 | 32 |
| 53 | 10 | 42 |
| 54 | 2 | 44 |
| 55 | 1 | 45 |
Here, n = 45, which is odd.
∴ Median = `("n" + 1)/(2)`th observation
= 23rd observation = 52.
(∵ All observation from 21st to 32nd are equal, each = 52).
APPEARS IN
RELATED QUESTIONS
Calculate the median from the following data:
| Marks below: | 10 | 20 | 30 | 40 | 50 | 60 | 70 | 80 |
| No. of students: | 15 | 35 | 60 | 84 | 96 | 127 | 198 | 250 |
A survey regarding the height (in cm) of 51 girls of class X of a school was conducted and the following data was obtained:
| Height in cm | Number of Girls |
| Less than 140 | 4 |
| Less than 145 | 11 |
| Less than 150 | 29 |
| Less than 155 | 40 |
| Less than 160 | 46 |
| Less than 165 | 51 |
Find the median height.
Estimate the median for the given data by drawing an ogive:
| Class | 0 – 10 | 10 – 20 | 20 – 30 | 30 – 40 | 40 – 50 |
| Frequency | 4 | 9 | 15 | 14 | 8 |
Calculate the median from the following data:
| Height(in cm) | 135 - 140 | 140 - 145 | 145 - 150 | 150 - 155 | 155 - 160 | 160 - 165 | 165 - 170 | 170 - 175 |
| Frequency | 6 | 10 | 18 | 22 | 20 | 15 | 6 | 3 |
The median of the following data is 50. Find the values of p and q, if the sum of all the frequencies is 90.
| Marks: | 20 -30 | 30-40 | 40-50 | 50-60 | 60-70 | 70-80 | 80-90 |
| Frequency: | P | 15 | 25 | 20 | q | 8 | 10 |
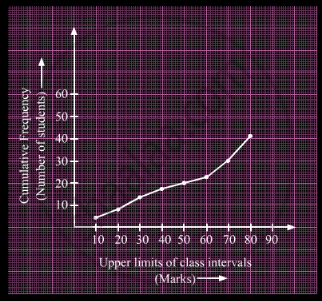
A student draws a cumulative frequency curve for the marks obtained by 40 students of a class as shown below. Find the median marks obtained by the students of the class.

Write the median class of the following distribution:
| Class-interval: | 0−10 | 10−20 | 20−30 | 30−40 | 40−50 | 50−60 | 60−70 |
| Frequency: | 4 | 4 | 8 | 10 | 12 | 8 | 4 |
The median of first 10 prime numbers is
The median of the following data is 525. Find the values of x and y, if the total frequency is 100.
| Class interval | Frequency |
| 0 – 100 | 2 |
| 100 – 200 | 5 |
| 200 – 300 | x |
| 300 – 400 | 12 |
| 400 – 500 | 17 |
| 500 – 600 | 20 |
| 600 – 700 | y |
| 700 – 800 | 9 |
| 800 – 900 | 7 |
| 900 – 1000 | 4 |
A survey conducted on 20 households in a locality by a group of students resulted in the following frequency table for the number of family members in a household:
| Family size | 1 – 3 | 3 – 5 | 5 – 7 | 7 – 9 | 9 – 11 |
| Numbers of Families | 7 | 8 | 2 | 2 | 1 |
Find the median of this data.
