Advertisements
Advertisements
Question
A survey regarding the height (in cm) of 51 girls of class X of a school was conducted and the following data was obtained:
| Height in cm | Number of Girls |
| Less than 140 | 4 |
| Less than 145 | 11 |
| Less than 150 | 29 |
| Less than 155 | 40 |
| Less than 160 | 46 |
| Less than 165 | 51 |
Find the median height.
Solution
To calculate the median height, we need to find the class intervals and their corresponding frequencies
The given distribution being of thee less than type 140, 145, 150,…..,165 give the upper limits of the corresponding class intervals. So, the classes should be below 140, 145, 150,......, 160, 165 observe that from the given distribution, we find that there are 4-girls with height less than 140 is 4. Now there are 4 girls with heights less than 140. Therefore, the number of girls with height in the interval 140, 145 is 11- 4=7, similarly. The frequencies of 145 150 is 29-11=18, for 150-155 it is 40-29=11, and so on so our
frequencies distribution becomes.
| Class interval | Frequency | Cumulative frequency |
| below 140 | 4 | 4 |
| 140-145 | 7 | 11 |
| 145-150 | 18 | 29 |
| 150-155 | 11 | 40 |
| 155-160 | 6 | 46 |
| 160-165 | 5 | 51 |
Now N = 51
So, N/2=51/2=25.5
Now, the cumulative frequency just greater than 25.5 is 29 and the corresponding class is 145 - 150.
Therefore, 145 - 150 is the median class.
l = 145, f = 18, F = 11 and h = 5
We know that
Median `=l+(N/2-F)/fxxh`
`=145+(25.5-11)/18xx5`
`=145+14.5/18xx5`
`=145+72.5/18`
= 145 + 4.03
= 149.03
Hence, the median height is 149.03
APPEARS IN
RELATED QUESTIONS
Below is the given frequency distribution of words in an essay
| Number of Words | Number of Candidates |
| 600 – 800 | 8 |
| 800 – 1000 | 22 |
| 1000 – 1200 | 40 |
| 1200 – 1400 | 18 |
| 1400 - 1600 | 12 |
Find the mean number of words written.
For a certain frequency distribution, the values of Assumed mean (A) = 1300, `sumf_id_i` = 900 and `sumfi` = 100. Find the value of mean (`barx`) .
Calculate the missing frequency from the following distribution, it being given that the median of the distribution is 24.
| Age in years | 0 - 10 | 10 - 20 | 20 - 30 | 30 - 40 | 40 - 50 |
| No. of persons | 5 | 25 | ? | 18 | 7 |
The following table gives the frequency distribution of married women by age at marriage:
| Age (in years) | Frequency |
| 15-19 | 53 |
| 20-24 | 140 |
| 25-29 | 98 |
| 30-34 | 32 |
| 35-39 | 12 |
| 40-44 | 9 |
| 45-49 | 5 |
| 50-54 | 3 |
| 55-59 | 3 |
| 60 and above | 2 |
Calculate the median and interpret the results.
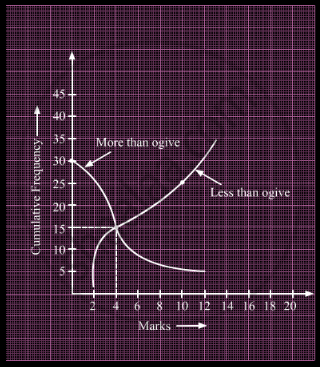
What is the value of the median of the data using the graph in the following figure of less than ogive and more than ogive?

Calculate the median of the following distribution:
| No. of goals | 0 | 1 | 2 | 3 | 4 | 5 |
| No. of matches | 2 | 4 | 7 | 6 | 8 | 3 |
In a hospital, weights of new born babies were recorded, for one month. Data is as shown:
| Weight of new born baby (in kg) | 1.4 - 1.8 | 1.8 - 2.2 | 2.2 - 2.6 | 2.6 - 3.0 |
| No of babies | 3 | 15 | 6 | 1 |
Then the median weight is?
Pocket expenses of a class in a college are shown in the following frequency distribution:
| Pocket expenses |
0 - 200 |
200 - 400 |
400 - 600 |
600 - 800 |
800 - 1000 |
1000 - 1200 |
1200 - 1400 |
| Number of students | 33 | 74 | 170 | 88 | 76 | 44 | 25 |
Then the median for the above data is?
The median of 100 observations grouped in classes of equal width is 25. If the median class interval is 20 –30 and the number of observations less than 20 is 45, then the frequency of median class is ______.
A life insurance agent found the following data for distribution of ages of 100 policy holders. Calculate the median age, if policies are given only to persons having age 18 years onwards but less than 60 year.
| Age (in years) | Number of policy holders |
| Below 20 | 2 |
| Below 25 | 6 |
| Below 30 | 24 |
| Below 35 | 45 |
| Below 40 | 78 |
| Below 45 | 89 |
| Below 50 | 92 |
| Below 55 | 98 |
| Below 60 | 100 |
