Advertisements
Advertisements
Question
A life insurance agent found the following data for distribution of ages of 100 policy holders. Calculate the median age, if policies are given only to persons having age 18 years onwards but less than 60 years.
| Age (in years) | Number of policy holders |
| Below 20 | 2 |
| 20 - 25 | 4 |
| 25 - 30 | 18 |
| 30 - 35 | 21 |
| 35 - 40 | 33 |
| 40 - 45 | 11 |
| 45 - 50 | 3 |
| 50 - 55 | 6 |
| 55 - 60 | 2 |
Solution
Here, class width is not the same. There is no requirement of adjusting the frequencies according to class intervals. The given frequency table is of less than type represented with upper class limits. The policies were given only to persons with age 18 years onwards but less than 60 years. Therefore, class intervals with their respective cumulative frequency can be defined as below
| Class Interval | Number of policy holders (f) | Cumulative frequency (cf) |
| Below 20 | 2 | 2 |
| 20 - 25 | 6 - 2 = 4 | 6 |
| 25 - 30 | 24 - 6 = 18 | 24 |
| 30 - 35 | 45 - 24 = 21 | 45 |
| 35 - 40 | 78 - 45 = 33 | 78 |
| 40 - 45 | 89 - 78 = 11 | 89 |
| 45 - 50 | 92 - 89 = 3 | 92 |
| 50 - 55 | 98 - 92 = 6 | 98 |
| 55 - 60 | 100 - 98 = 2 | 100 |
It is given that n = 100
Cumulative frequency (cf) just greater than `n/2(100/2 = 50)` is 78, belonging to interval 35 - 40.
Therefore, median class = 35 - 40
Lower limit of median class (l) = 35
Class size (h) = 5
Frequency of median class (f) = 33
Cumulative frequency (cf) of class preceding median class = 45
Median = `l + ((n/2-cf)/f)xxh`
= `35 + ((50-45)/33)xx5`
= `35 + 25/33`
= 35 + 0.76
= 35.76
Therefore, the median age is 35.76 years.
RELATED QUESTIONS
The median of the following observations
11, 12, 14, (x - 2), (x + 4), (x + 9), 32, 38, 47 arranged in ascending order is 24.
Find the value of x and hence find the mean.
The following frequency distribution table gives the ages of 200 patients treated in a hospital in a week. Find the mode of ages of the patients.
| Age (years) | Less than 5 | 5 - 9 | 10 - 14 | 15 - 19 | 20 - 24 | 25 - 29 |
| No. of patients | 38 | 32 | 50 | 36 | 24 | 20 |
The annual rainfall record of a city for 66 days is given in the following table :
| Rainfall (in cm ): | 0-10 | 10-20 | 20-30 | 30-40 | 40-50 | 50-60 |
| Number of days : | 22 | 10 | 8 | 15 | 5 | 6 |
Calculate the median rainfall using ogives of more than type and less than type.
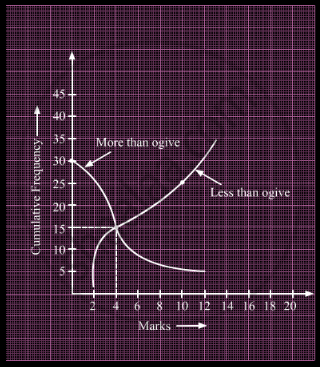
What is the value of the median of the data using the graph in the following figure of less than ogive and more than ogive?
Obtain the median for the following frequency distribution:
| x : | 1 | 2 | 3 | 4 | 5 | 6 | 7 | 8 | 9 |
| f : | 8 | 10 | 11 | 16 | 20 | 25 | 15 | 9 | 6 |
If 35 is removed from the data, 30, 34, 35, 36, 37, 38, 39, 40 then the median increases by ______.
The abscissa of the point of intersection of the less than type and of the more than type cumulative frequency curves of a grouped data gives its ______.
Consider the following frequency distribution:
| Class | 0 – 5 | 6 – 11 | 12 – 17 | 18 – 23 | 24 – 29 |
| Frequency | 13 | 10 | 15 | 8 | 11 |
The upper limit of the median class is:
Will the median class and modal class of grouped data always be different? Justify your answer.
Weekly income of 600 families is tabulated below:
| Weekly income (in Rs) |
Number of families |
| 0 – 1000 | 250 |
| 1000 – 2000 | 190 |
| 2000 – 3000 | 100 |
| 3000 – 4000 | 40 |
| 4000 – 5000 | 15 |
| 5000 – 6000 | 5 |
| Total | 600 |
Compute the median income.
